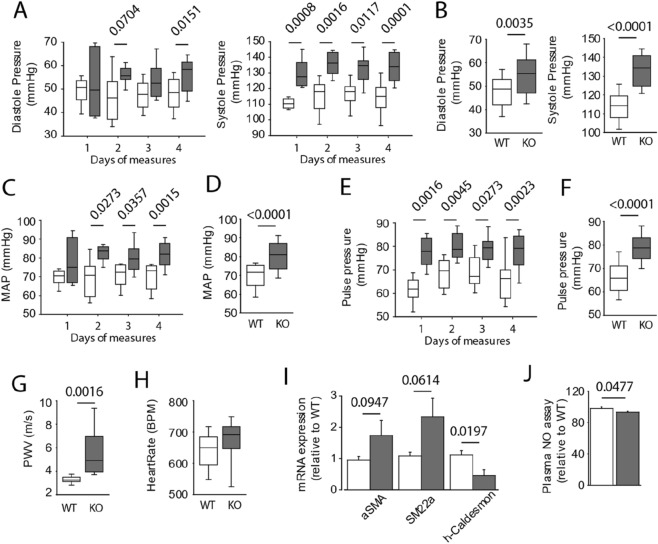
Figure 1.
Apelin deficiency induction of arterial hypertension (AHT) in Apelin-knockout mice (KO-APL mice, grey bars, n = 8) as compared to wild-type mice (WT, white bar, n = 8). (A) Diastolic and systolic pressure measured using the tail cuff method, with all measurements obtained once per day for 4 consecutive days. (B) Mean arterial pressure (MAP) calculated from diastolic and systolic pressure. (C) Pulse pressure corresponds to the difference between diastolic and systolic pressure. (D) Mean pressure (systole and diastole) obtained on day 4 of the measurements (see panel A). (E) Mean MAP obtained on day 4 of the measurements (see panel B). (F) Mean pulse pressure obtained on day 4 of the measurements (see panel C). (G) Velocity of propagation of the aorta measured by the pulse wave speed (PVW). (H) Heart rate expressed in beat per minutes. (I) mRNA expression of smooth muscle contraction markers include alpha smooth muscle actin (αSMA), smooth muscle 22 alpha (SM22α), h-caldesmon. (J) Plasma nitrogen oxide (NO) assay. The results are the mean ± SEM. Statistically significant differences (Mann–Whitney).

