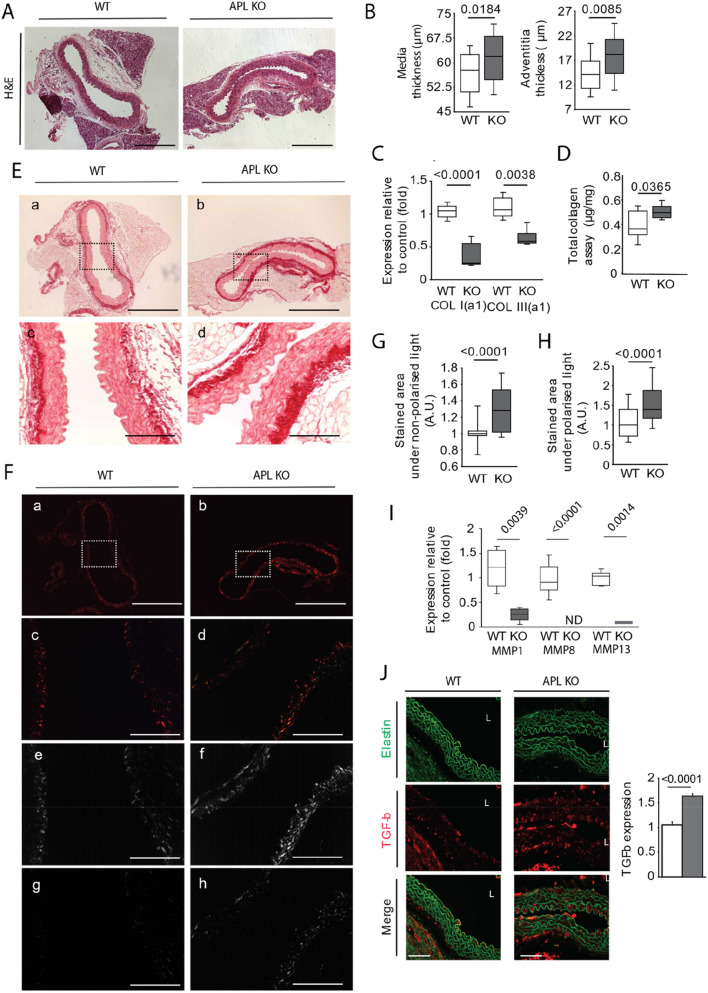
Figure 2.
Collagen expression in the aortas of Apelin-knockout mice (KO-APL mice, grey bars, n = 8) and wild-type mice (WT, white bar, n = 8). (A) Representative hematoxylin–eosin (H&E) staining. The scale bar represents 250 μm. (B) Scatter plots show the intima–media tunica thickness and adventitia tunica thickness. The mean and 95% confidence interval were calculated in the normal domain after log transformation. (C) Total collagen assay. (D) mRNA expression of type I(α1) collagen and type III(α1) collagen. (E) Representative picrosirius red staining observed by nonpolarized light in eight slices per animal and condition (panels a and b). The scale bars for panels a–b correspond to 250 µm. Panels c and d are magnified images of panels a and b. The scale bars correspond to 60 µm. (F) Representative picrosirius red staining observed by polarized light (panels a and b). The scale bars correspond to 250 µm. Panels c and d are magnified images of panels a and b. The scale bars correspond to 60 µm. The scale bars for panels a–d correspond to 250 µm. The scale bars for panels e–h correspond to 60 µm. Panels e and f correspond to yellow-orange birefringence of type I collagen. Panels g and h correspond to green birefringence of type III collagen. (G) Semi-quantification of total collagen from picrosirius red staining visualized by nonpolarized light. (H) Semi-quantification of collagen I and III from picrosirius red staining visualized by polarized light. (I) mRNA expression of several collagenases, including metalloprotease 1 (MMP1), MMP8, and MMP13. (J) Immunostaining against transforming growth factor β (TGFβ), showing an TGFβ accumulation in the media in the APL-KO mice. The results are the mean ± SEM. Statistically significant differences (Mann–Whitney).

