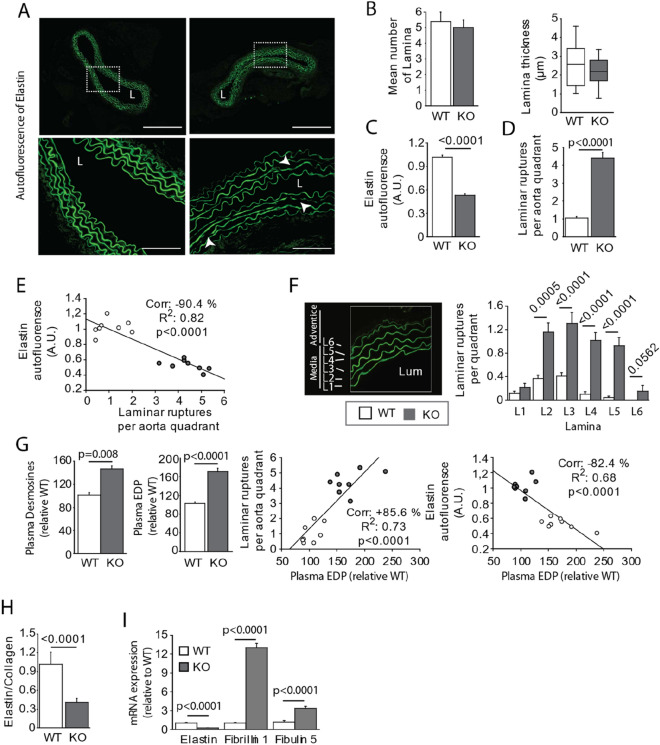
Figure 3.
Spatial distribution of laminar ruptures in Apelin-knockout mice (KO-APL mice, grey bars, n = 8) and wild-type mice (WT, white bar, n = 8). (A) Representative autofluorescence of elastin (image of top panel). The scale bar represents 250 μm. The images in the bottom panel are magnified images of top panel. The scale bar represents 60 μm. (B) Bar plots indicate the number and thickness of lamina per aorta quadrant, Was something quantified according to the method of Trachet et al.18. (C) Quantification of autofluorescence level of elastin in aorta section. This quantification was performed by the staining obtained from three aorta slices were averaged per animal to account for intra-animal variation. (D) Laminar ruptures in four quadrants of three aorta sections per animal were calculated. (E) Graph depicting linear relationships between the mean elastin autofluorescence and mean laminar rupture number obtained for each animal (WT, white circles; KO, grey circles). (F) Representation of the numeration of elastic lamellae (L1 to L6, left panel). L, aortic lumen. Number of laminar ruptures per quadrant (right panel). (G) Plasma desmosine and EDP levels (left), with graphs depicting linear relationships (middle panel) between 1) plasma EDP and the mean laminar rupture number obtained for each animal studied and 2) plasma EDP and mean elastin autofluorescence obtained for each animal studied (WT, white dots; KO, grey dots). (H) Aortic stiffeness evaluation defined by Elastin:Collagen Ratio. Elastin correspond to elastin autofluorescence (data obtained in C)—collagen correspond to picrosirius red staining (data obtained in Fig. 2G). (I) mRNA expression of elastin, fibrillin-1, and fibulin-5 obtained by real-time qPCR (quantitative polymerase chain reaction). The results are the mean ± SEM. Statistically significant differences (Mann–Whitney).

