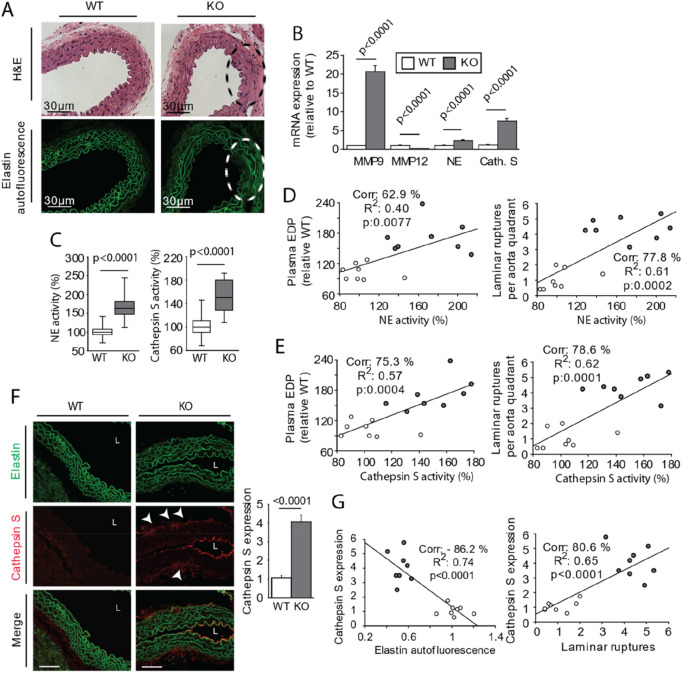
Figure 4.
Increase of the activity of cathepsin S in the aortic wall of Apelin-knockout mice (KO-APL mice, grey bars, n = 8) as compared wild-type mice (WT, white bar, n = 8). (A) Hematoxylin–eosin (H&E) staining and autofluorescence of elastin showing fragmentation of inner laminae (L1–L4), a characteristic of aneurism development. (B) mRNA expression of matrix metalloproteinases (MMPs) -9 and 12. Neutrophil elastase (NE), Cathepsin S (Cath. S). (C) Bar plots indicate neutrophil elastase activity (left) and cathepsin S activity (right). (D) Graph depicting linear relationships between neutrophil elastase activity and plasma EDP levels (right) and mean laminar rupture number obtained for each animal studied (right, WT, white dots; KO, grey dots). (E) Graph depicting linear relationships between cathepsin S activity (left) and plasma EDP levels and the mean laminar rupture number obtained for each animal studied (right, WT, white circles; KO, grey circles). (F) Immunostaining against cathepsin S showing accumulation in lumen of aorta (L) near the tunica intima and between the tunica media and tunica adventitia (arrows). (G) Graph depicting linear relationships between cathepsin S staining and laminar rupture number (left) and elastin autofluorescence (right, WT, white circles; KO, grey circles). The results are the mean ± SEM. Statistically significant differences (Mann–Whitney).

