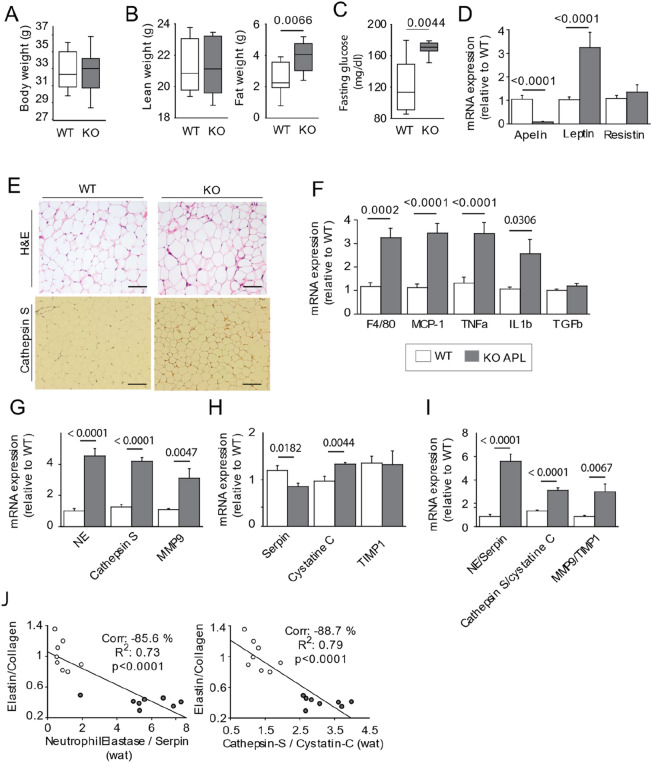
Figure 5.
Remodeling of visceral adipose of Apelin-knockout mice (KO-APL mice, grey bars, n = 8) as compared wild-type mice (WT, white bar, n = 8). (A) Body weight, (B) lean and fat weights (C) Blood fasting glucose. (D) mRNA expression of leptin and resistin in perigonadic white adipose tissue. (E) Hematoxylin & Eosin staining (top) and immunostaining against Cathepsin S (bottom) (F) mRNA expression of inflammatory markers, including F4/80 and monocyte chemoattractant protein 1, tumor necrosis factor (TNFβ), interleukin 1β (IL1β), and transforming growth factor β (TGFβ). (G) mRNA expression of elastases, such as neutrophil elastase, cathepsin S, and MMP9 (metalloproteinase). WT, white bars; APL-KO, grey bars. (H) mRNA expression of Elastase inhibitors (serpin, cystatin C, and tissue inhibitor of metalloproteinase 1 [TIMP1]). (I) Elastases and its inhibitors Ratio. (J) Univariate correlation obtained by Z-test between the aortic stiffness (determined from elastin:collagen ratio and shown in Fig. 3J) and visceral adipose tissue remodeling (determined from the protease:inhibitor ratio and shown in I). The results are the mean ± SEM. Statistically significant differences (Mann–Whitney).

