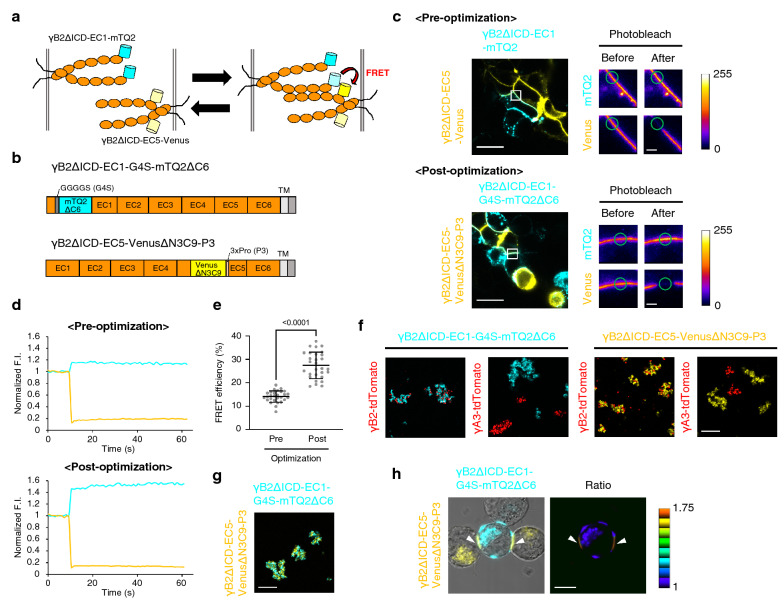
Figure 2.
The γB2 trans interaction monitored by FRET-based γB2 indicators. (a) Schematics of the γB2 trans interaction, as visualized using the FRET-based γB2 indicators. The orange ovals represent the EC domains of γB2. mTQ2 and Venus are represented as cyan and yellow cylinders, respectively. (b) Schematics of linker-optimized FRET-based γB2 indicators. The C-terminal 6 amino acids of mTQ2 are deleted, and a GGGGS (G4S) linker is inserted at the N-terminus of mTQ2 in γB2ΔICD-EC1-G4S-mTQ2ΔC6. The 3 N-terminal amino acids and the 9 C-terminal amino acids of Venus are deleted, and a 3xPro (P3) linker is inserted at the C-terminus of Venus in γB2ΔICD-EC5-VenusΔN3C9-P3. (c) Representative acceptor photobleaching experiments of the pre- and post-optimized FRET-based γB2ΔICD indicators in HEK293T cells. HEK293T cells individually expressing the indicated constructs were co-cultured (left panels). The panels on the right represent magnified fluorescence images of white squared regions in left panels before and after acceptor photobleaching at green circles. The color bars indicate the range of the fluorescence intensities of mTQ2 and Venus (arbitrary units). Scale bars, 20 μm (left panel) and 2 μm (right panel). (d) Alterations in fluorescence intensities of mTQ2 and Venus by acceptor photobleaching in (c) were followed and plotted over time. (e) Mean values of FRET efficiency for the pre- and post-optimized FRET-based γB2ΔICD indicators (Pre, n = 28; Post, n = 29). Data are shown as the means ± SD. Significant difference was analyzed by Welch’s t test. p value is described in the graph. (f) Binding specificity of the FRET-based γB2ΔICD indicators by cell aggregation assay. K562 cells individually expressing the indicated constructs were co-cultured. Scale bar, 200 μm. (g) The interaction between γB2ΔICD-EC1-mTQ2ΔC6 and γB2ΔICD-EC5-VenusΔN3C9-P3, as revealed by cell aggregation assay. K562 cells individually expressing the indicated constructs were co-cultured. Scale bar, 200 μm. (h) Direct visualization of the γB2 trans interaction using the FRET-based γB2ΔICD indicators. K562 cells individually expressing the indicated constructs were co-cultured. The merged fluorescence and DIC image is shown in the left panel. The ratio image of Venus/mTQ2 is shown as intensity-modulated display (IMD) in the right panel. Scale bar, 10 μm.

