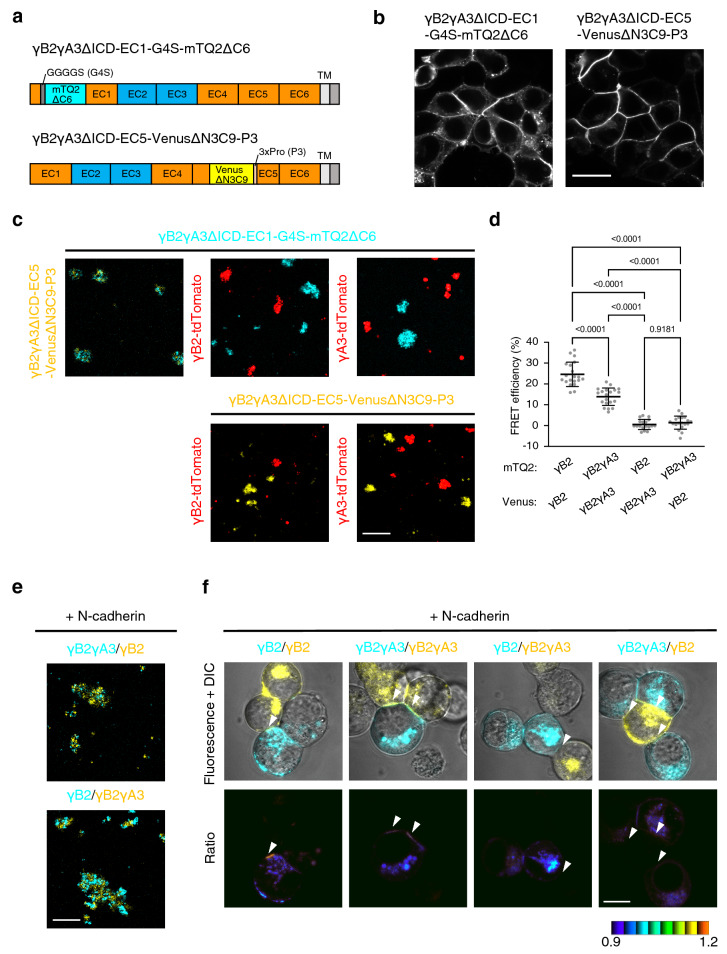
Figure 3.
Specificity of FRET-based γB2ΔICD indicators. (a) Schematics of FRET-based chimeric γB2γA3ΔICD indicators. The EC2-EC3 domains of the FRET-based γB2ΔICD indicators were swapped by those of γA3. The orange and light blue boxes are the EC domains from γB2 and γA3, respectively. (b) The localization of the FRET-based chimeric γB2γA3ΔICD indicators in HEK293T cells. Scale bar, 20 μm. (c) Binding specificity of the FRET-based chimeric γB2γA3ΔICD indicators, as revealed by cell aggregation assay. K562 cells individually expressing the indicated constructs were co-cultured. Scale bar, 200 μm. (d) Evaluation of the FRET-based chimeric γB2γA3ΔICD indicators and the FRET-based γB2ΔICD indicators by acceptor photobleaching in HEK293T cells. Acceptor photobleaching at the cell adhesion sites was performed using co-cultured HEK293T cells in the indicated combination, and FRET efficiency was calculated [n = 20 (γB2–γB2), n = 20 (γB2γA3–γB2γA3), n = 18 (γB2–γB2γA3), n = 19 (γB2γA3–γB2). The combination is described as mTQ2-Venus pair]. Data are shown as the means ± SD. Significant differences were analyzed by Welch’s ANOVA test, followed by Dunnett’s T3 multiple comparison test. p values are indicated in the graph. (e) Cell aggregation between the FRET-based γB2ΔICD- and chimeric γB2γA3ΔICD indicator-expressing cells, mediated by co-expressing N-cadherin. K562 cells individually expressing the indicated FRET constructs and N-cadherin were co-cultured. Scale bar, 200 μm. (f) FRET between the FRET-based γB2ΔICD- and chimeric γB2γA3ΔICD indicators. K562 cells expressing N-cadherin and the FRET-based γB2ΔICD- or the chimeric γB2γA3ΔICD indicators were co-cultured in the indicated combination. The merged fluorescence and DIC images are shown in the upper panels. The ratio images of Venus/mTQ2 are shown as IMD in the lower panels. mTQ2- and Venus-positive cell adhesion sites are indicated by white arrowheads. Scale bar, 10 μm.

