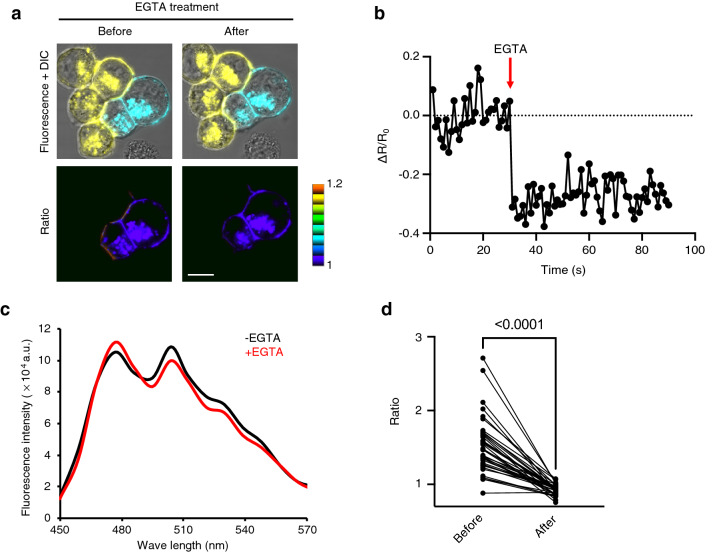
Figure 4.
Ca2+-dependency of γB2 trans interaction. (a) The effect of EGTA treatment on the FRET at the cell adhesion sites. K562 cells individually expressing the FRET-based γB2ΔICD indicators were co-cultured. The merged fluorescence and DIC images (upper panels) and the ratio images of Venus/mTQ2 (lower panels) were acquired before and after 5 mM EGTA treatment. Scale bar, 10 μm. (b) Change in Venus/mTQ2 ratio (ΔR/R0) at a cell adhesion site with EGTA treatment over time. EGTA (5 mM) was added to the medium at 30 s. R0 was calculated as the average Venus/mTQ2 ratio value of 30 frames before EGTA treatment. (c) Emission spectra before and after EGTA treatment. The emission spectra excited by 405 nm light at the cell adhesion site before and after 5 mM EGTA treatment were acquired. (d) Quantitative analysis of ratio changes by EGTA treatment. The FRET ratio values at the cell adhesion sites before and after 5 mM EGTA treatment were measured (n = 38). Significant difference was analyzed by Wilcoxon matched-pairs signed rank test. p value is indicated in the graph.

