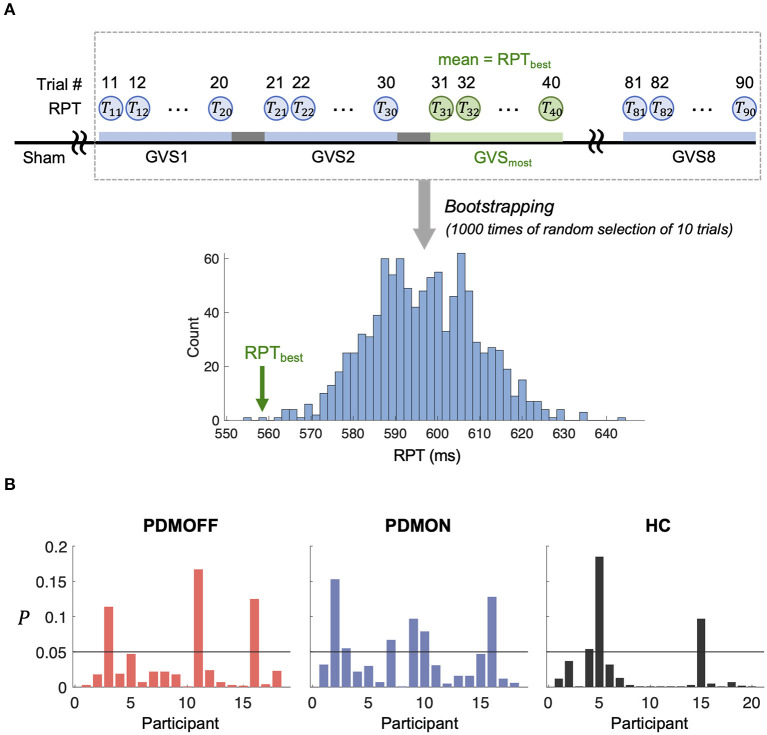
Figure 6.
(A) Schematic diagram showing a process to generate an empirical distribution of RPT for each participant. Each bootstrap sample randomly selects RPTs of 10 trials and the mean of the bootstrap samples is computed to generate the distribution. RPTbest represents the mean RPT during GVSmost. (B) P value of RPTbest computed based on (A) is shown for every participant.

