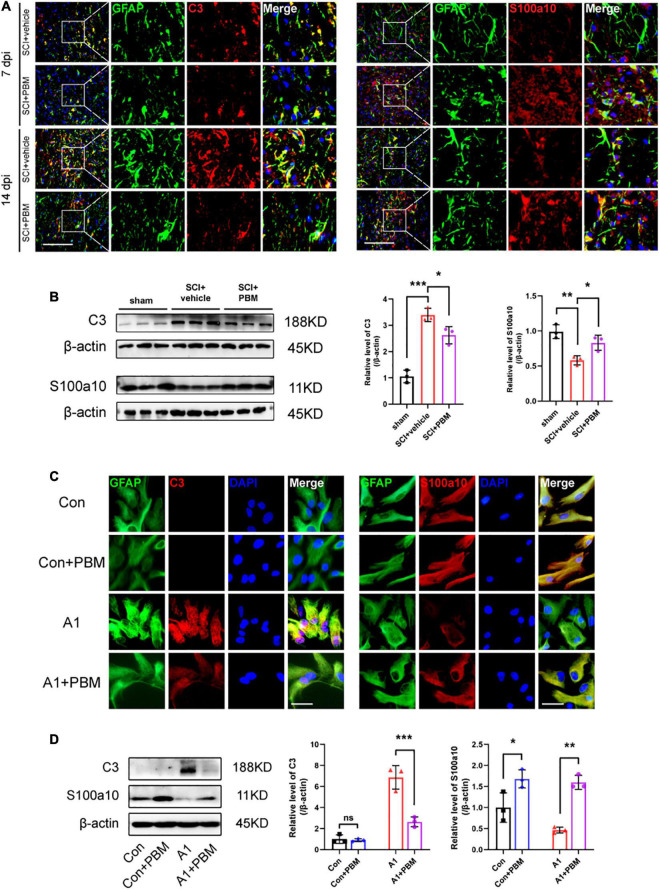
FIGURE 3.
Photobiomodulation modulated the transformation of A1/A2 astrocytes. (A) Representative images of immunofluorescence staining for GFAP (green) and C3 (red) or S100a10 (red) in the lesion area 150 μm from the epicenter in the SCI + vehicle and SCI + PBM groups at 7 and 14 dpi. Scale bar: 200 μm. (B) Western blot analysis and quantification of the expression levels of C3 and S100a10 in each group at 7 dpi (n = 3 individuals per group). (C) Representative immunofluorescence images of GFAP (green) and C3 (red) or S100a10 (red) in astrocytes in the control, control + PBM, A1, and A1 + PBM groups. Con, control; A1, A1 astrocytes. Scale bar: 200 mm. (D) Representative blots and quantification of the expression levels of C3 and S100a10 in each group. The experiments were independently repeated three times. *p < 0.05, **p < 0.01, ***p < 0.001.

