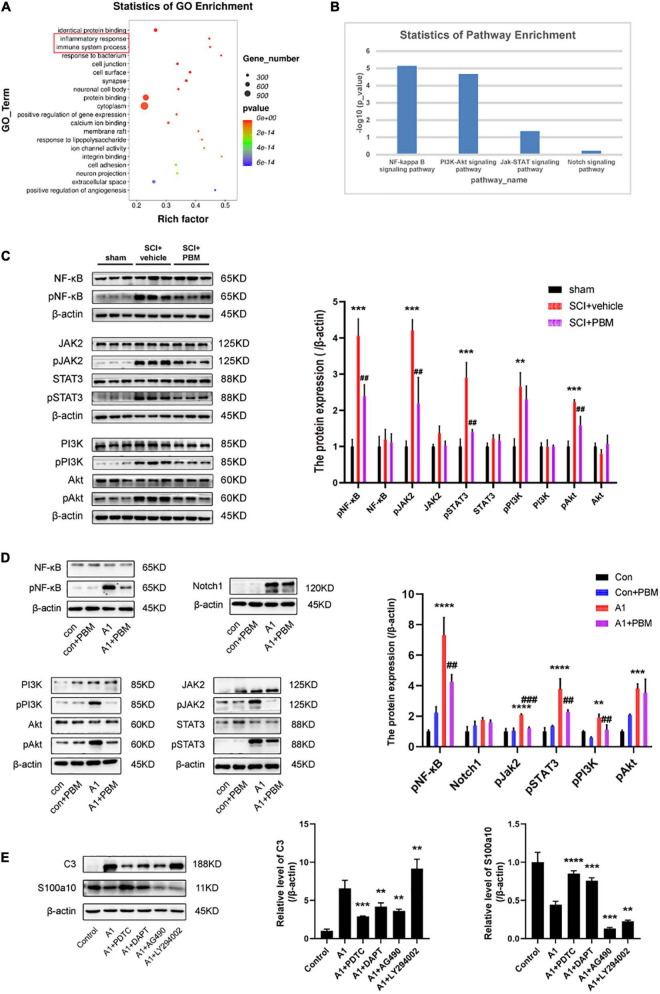
FIGURE 4.
Signaling pathways involved in A1/A2 astrocyte activation were regulated by PBM. (A) GO function analysis between the SCI-7d group and sham control group. The inflammatory response and immune system process were dramatically activated. (B) The histogram shows the –log10 (p-value) of the NF-κB pathway, PI3K–Akt pathway, JAK–STAT pathway, and Notch pathway (comparison between multiple groups vs. the sham control group), as determined by KEGG enrichment analysis. (C) Western blot analysis of the expression of proteins related to the NF-κB signaling pathway, JAK2–STAT3 signaling pathway, and PI3K–Akt signaling pathway in the sham control, SCI + vehicle, and SCI + PBM groups at 7 dpi. Quantification of the relative protein levels of pNF-κB, NF-κB, pJAK2, JAK2, pSTAT3, STAT3, pPI3K, PI3K, pAkt, and Akt. n = 3 individuals per group. **p < 0.01, ***p < 0.001, the SCI + vehicle group vs. the sham control group; ##p < 0.01, the SCI + PBM group vs. the SCI + vehicle group. (D) Representative blots and quantification of the relative levels of pNF-κB, NF-κB, Notch1, pJAK2, JAK2, pSTAT3, STAT3, pPI3K, PI3K, pAkt, and Akt in the control, control + PBM, A1, and A1 + PBM groups. Con, control; A1, A1 astrocytes. The experiments were independently repeated three times. **p < 0.01, ***p < 0.001, ****p < 0.0001, the A1 group vs. the control group; ##p < 0.01, ###p < 0.001, the A1 + PBM group vs. the A1 group. (E) Representative blots and quantification of the relative levels of C3 and S100a10 in astrocytes treated with different inhibitors. The experiments were independently repeated three times. **p < 0.01, ***p < 0.001, ****p < 0.0001 vs. the A1 group.

