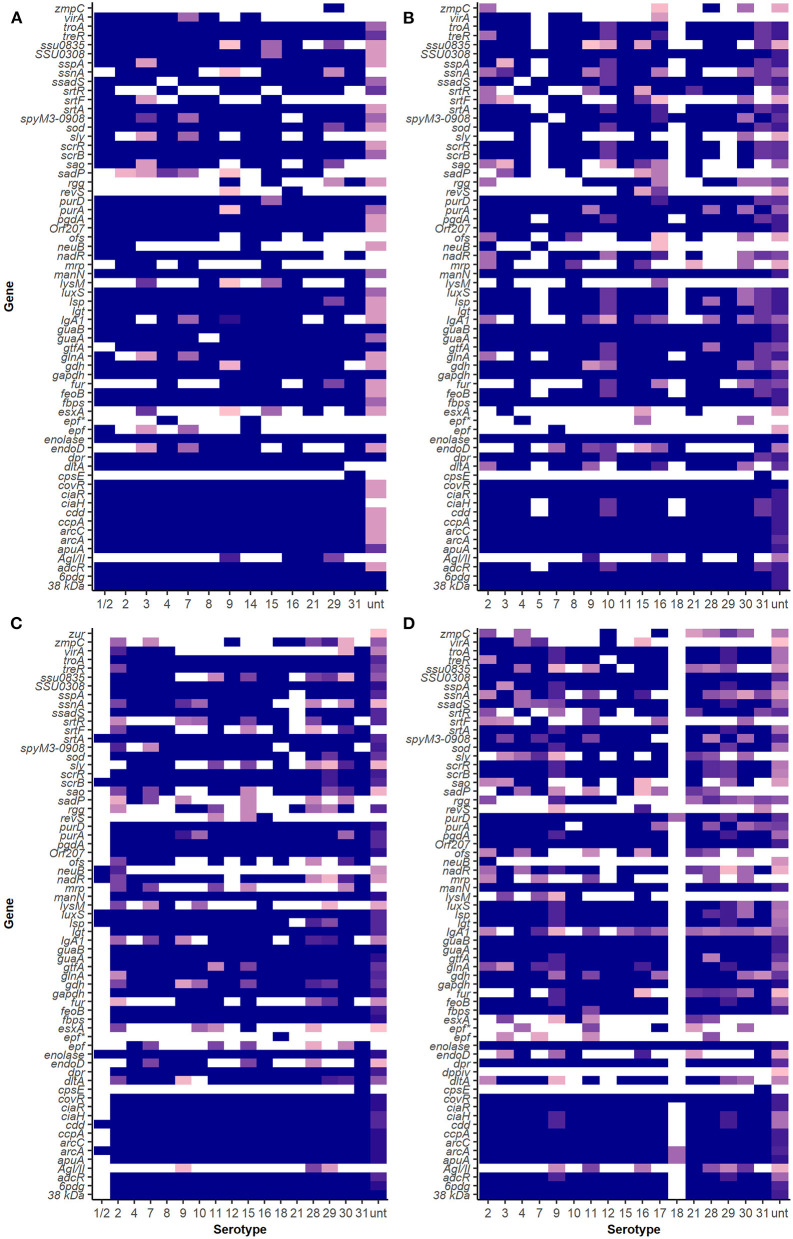
Figure 3.
Virulence-associated factor gene distribution among isolates in SC, NSC, NSP, and NSH groups. Darker shades show a higher proportion of isolates of a serotype carrying a particular gene. White indicates an absence of gene in that serotype. (A) Isolates recovered from systemic sites of pigs with confirmed infections (SC), (B) isolates recovered from non-systemic sites of pigs with confirmed infections (NSC), (C) isolates recovered from probable cases (NSP), and (D) isolates recovered from non-systemic sites of healthy pigs (NSH).

