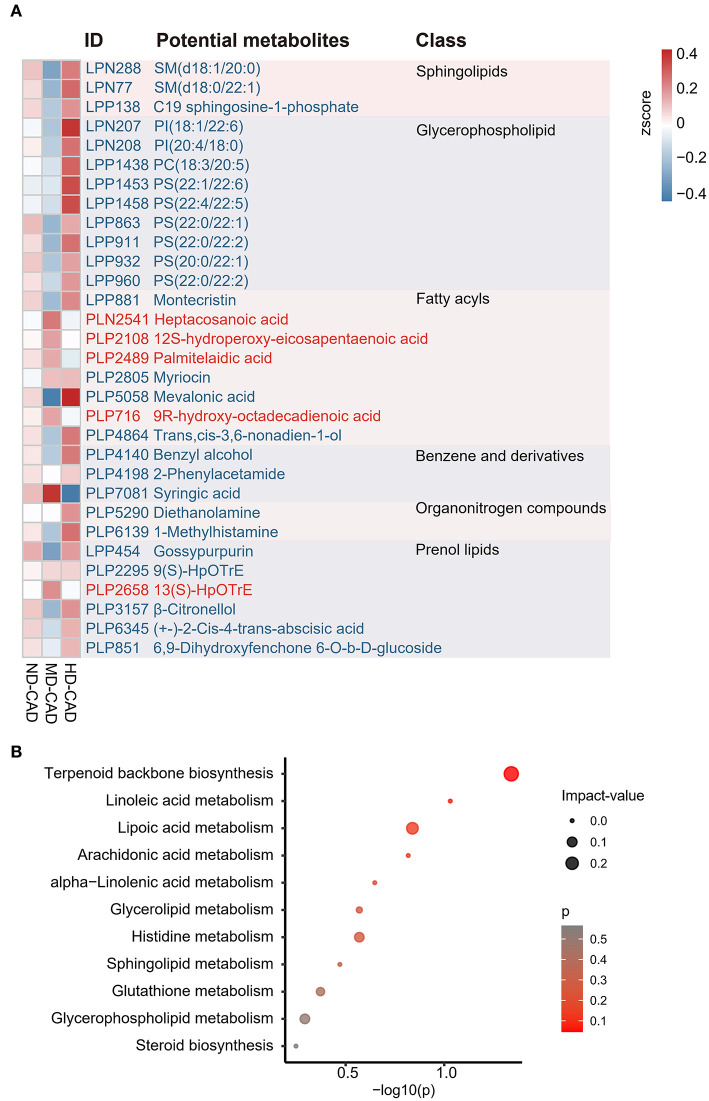
Figure 2.
Identification of the key metabolites associated with alcohol consumption in patients with CAD. (A) Heatmap showing part of the key metabolites associated with moderate alcohol consumption across three groups with CAD. (B) Bubble map demonstrating the potential metabolic pathways associated with moderate alcohol consumption using MetaboAnalyst. The IDs and the annotated potential metabolites are highlighted in red (enriched in MD-CAD) or blue (depleted in MD-CAD).

