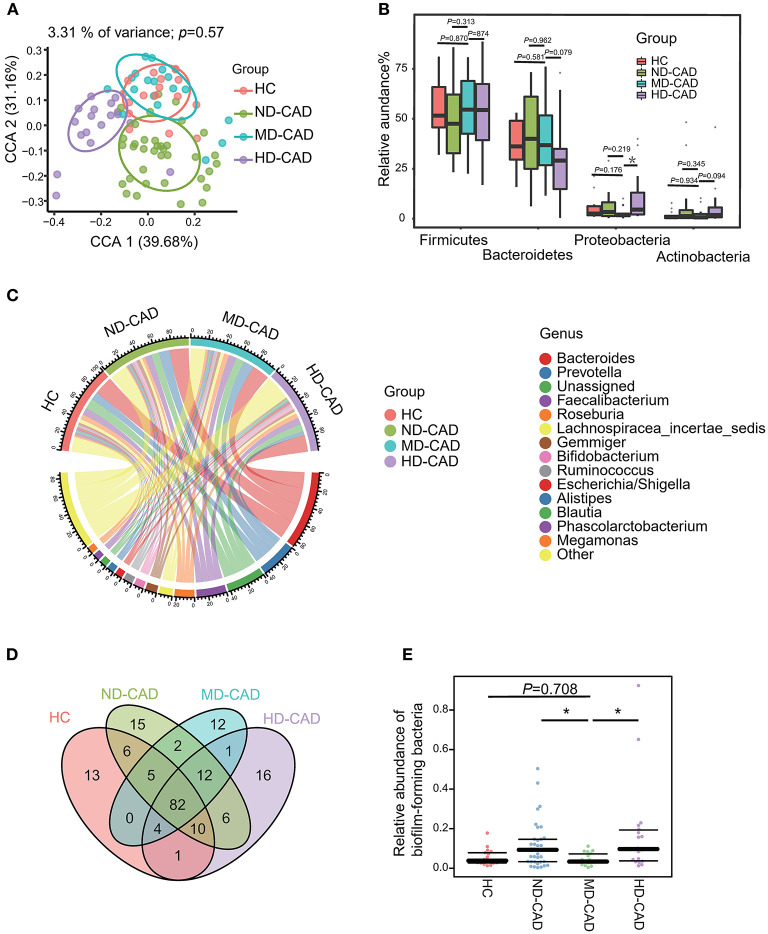
Figure 3.
Different alcohol consumption affects the taxonomic features of gut microbiota in patients with CAD. (A) Beta diversity analyzed by CPCoA plot based on Bray-Curtis distances (P = 0.57, Adonis Test). (B) Comparison of the relative abundance of gut microbiota at the phylum level (ns, not significant, *P < 0.05, Mann—Whitney U-test. Phylum Proteobacteria: MD-CAD vs. HC: P = 0.176, MD-CAD vs. ND-CAD: P = 0.219, MD-CAD vs. HD-CAD: P = 0.019). (C) Chord plot showing the dominant genera and their contribution to each group. (D) Venn plot indicating the number of overlapped OTUs. (E) Relative abundance of biofilm-forming bacteria predicted by BugBase (ns, not significant, *P < 0.05, Mann—Whitney U-test. MD-CAD vs. HC: P = 0.708, MD-CAD vs. ND-CAD: P = 0.015, MD-CAD vs. HD-CAD: P = 0.007).

