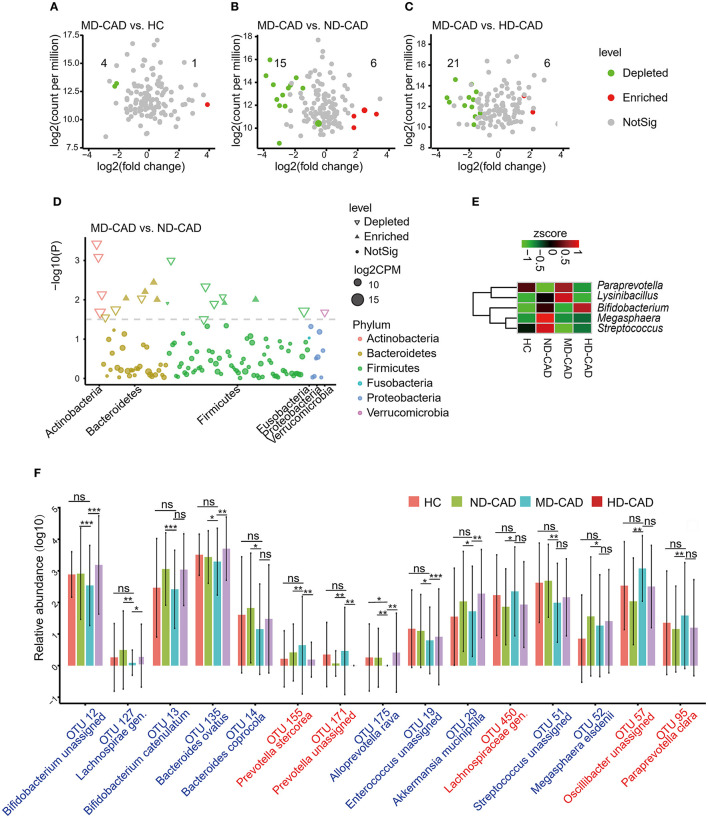
Figure 4.
Moderate alcohol consumption was associated with certain changes of intestinal flora in patients with CAD. (A–C) Volcano plots showing differential OTUs in patients with CAD with different levels of alcohol consumption. (A) MD-CAD vs. HC. (B) MD-CAD vs. ND-CAD. (C) MD-CAD vs. HD-CAD. The numbers labeled in the figures indicated significantly depleted OTUs (highlighted in green) or enriched OTUs (highlighted in red) in MD-CAD when compared with HC, ND-CAD, and HD-CAD, respectively. (D) Manhattan plot demonstrating the differentially abundant OTUs and their contributions to each phylum. (E) Heatmap showing the relative abundance of the genera that were significantly different between MD-CAD and ND-CAD. (F) An overview of the relative abundance of the differential OTUs associated with moderate alcohol consumption. The differential OTUs were filtered with P < 0.05 as well as FDR < 0.2. ns, not significant. *P < 0.05 and FDR < 0.2, **P < 0.01 and FDR < 0.2, ***P < 0.001 and FDR < 0.2, analyzed by edgeR.

