
Figure 2.
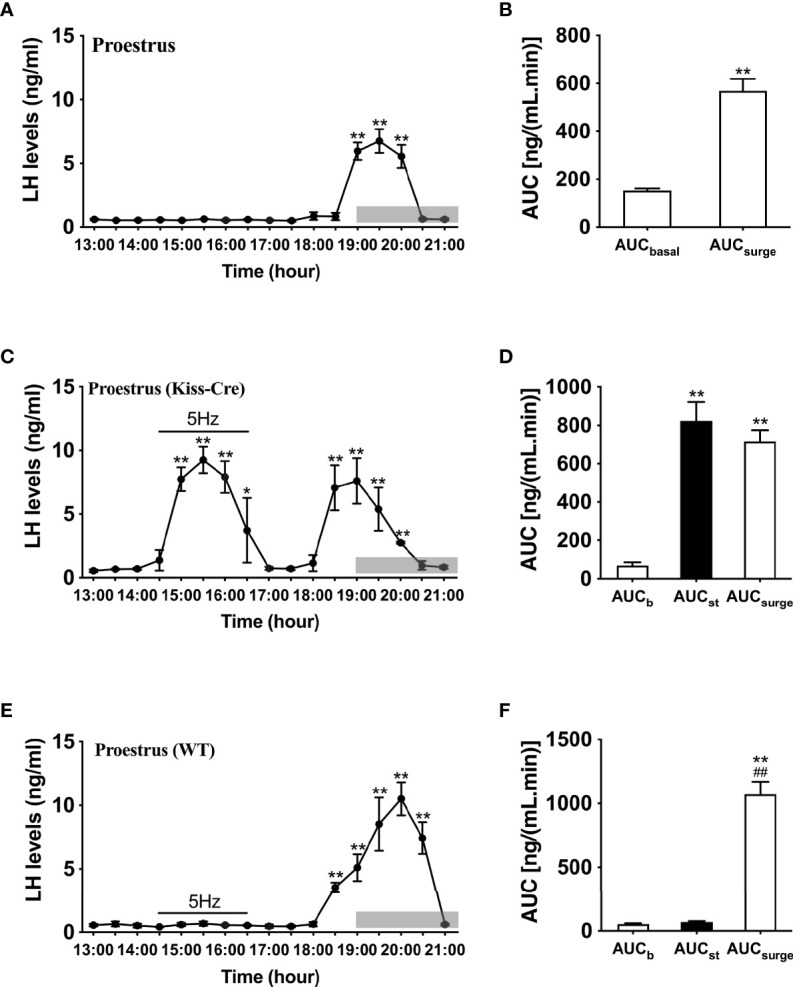
Spontaneous LH surge and LH surge-like response to optogenetic stimulation of ARC kisspeptin in proestrus Kiss-cre mice. (A) Circulating levels of LH (Mean ± SEM) in proestrus Kiss-cre mice sampled at 30-min intervals (13:00 – 21:00 h) showing spontaneous LH surges (n = 6). (B) Area under curve of LH levels for basal (AUCb, 13:00 - 17:30 h) and spontaneous LH surge (AUCsurge, 18:30 - 20:30 h) time periods. (C) Evoked LH secretion in response to sustained 5 Hz blue-light stimulations of ARC kisspeptin neuron cell bodies (14:30 - 16:30 h) in Kiss-Cre mice (n = 5). (D) Area under curve of LH levels before stimulation (basal) (AUCb, 13:00 - 14:30 h), during stimulation (AUCst, 14:30 - 16:30 h) and during the spontaneous surge (AUCSurge, 18:00 – 20:30 h) (n = 5). (E) LH levels of wild type (WT) mice sampled at 30-min intervals and subjected to same optic stimulation protocol as Kiss-cre mice (n = 4). (F) Area under curve of LH levels before stimulation (AUCb, 13:00 - 14:30 h), during stimulation (AUCst, 14:30 - 16:30 h) and during the spontaneous surge (AUCSurge, 18:00 - 21:00 h). *P < 0.05 and **P < 0.01 (unpaired t-test) relative to basal LH levels or AUC for basal LH levels. ##P< 0.01 indicates a significant difference relative to AUC for stimulation period. Lights off is at 19:00 h for all experiments, as indicated by the grey bar on the abscissa.