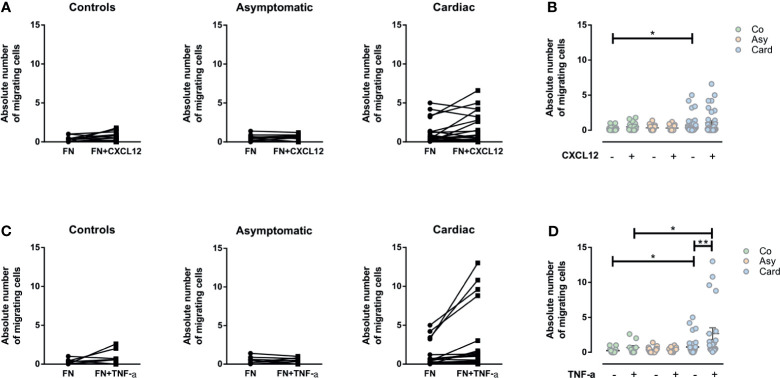
Figure 4.
Evaluation of the migratory capacity of peripheral blood mononuclear cells (PBMCs) driven by CXCL12 or TNF-α. (A) Graphs show the absolute numbers of by migrating PBMCs from control, asymptomatic, and cardiac subjects in transwell chambers coated by fibronectin (FN) or FN+CXCL12. (B) The absolute number of migrating PBMCs in the different groups without and with CXCL12. (C) The absolute number of migrating PBMCs in transwell chambers coated with FN and FN+TNF-α from control, asymptomatic, and cardiac subjects. (D) The absolute number of migrating PBMCs in the different groups without and with TNF-α. In all cases, the values shown correspond to specific migration after subtracting numbers obtained for each sample in wells coated with BSA alone. *p < 0.05 and **p < 0.01 versus Controls. Kruskal-Wallis followed by Mann-Whitney U test were used for statistical analyses. Co, Control (n = 20); Asy, Asymptomatic (n = 20); Card, Cardiac (n = 26).

