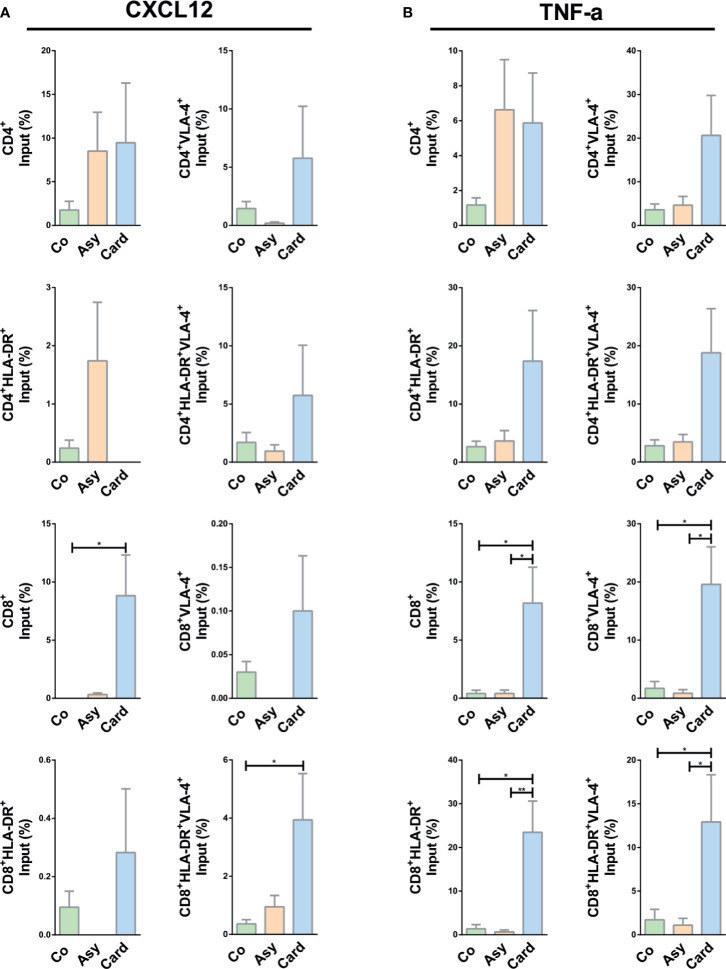
Figure 5.
CXCL12- or TNF-α-driven migratory response of T cells from chagasic patients. (A) Percentage of input of different T cell subpopulations expressing VLA-4 and HLA-DR in FN+CXCL12 coated transwells. (B) Percentages of input for different T-cell subpopulations expressing VLA-4 and HLA-DR in FN+ TNF-α coated transwells. *p < 0.05 and **p < 0.01 versus Controls. Kruskal-Wallis followed by Mann-Whitney U test were used for statistical analyses. Co, Control (n = 20); Asy, Asymptomatic (n = 20); Card: Cardiac (n = 26).

