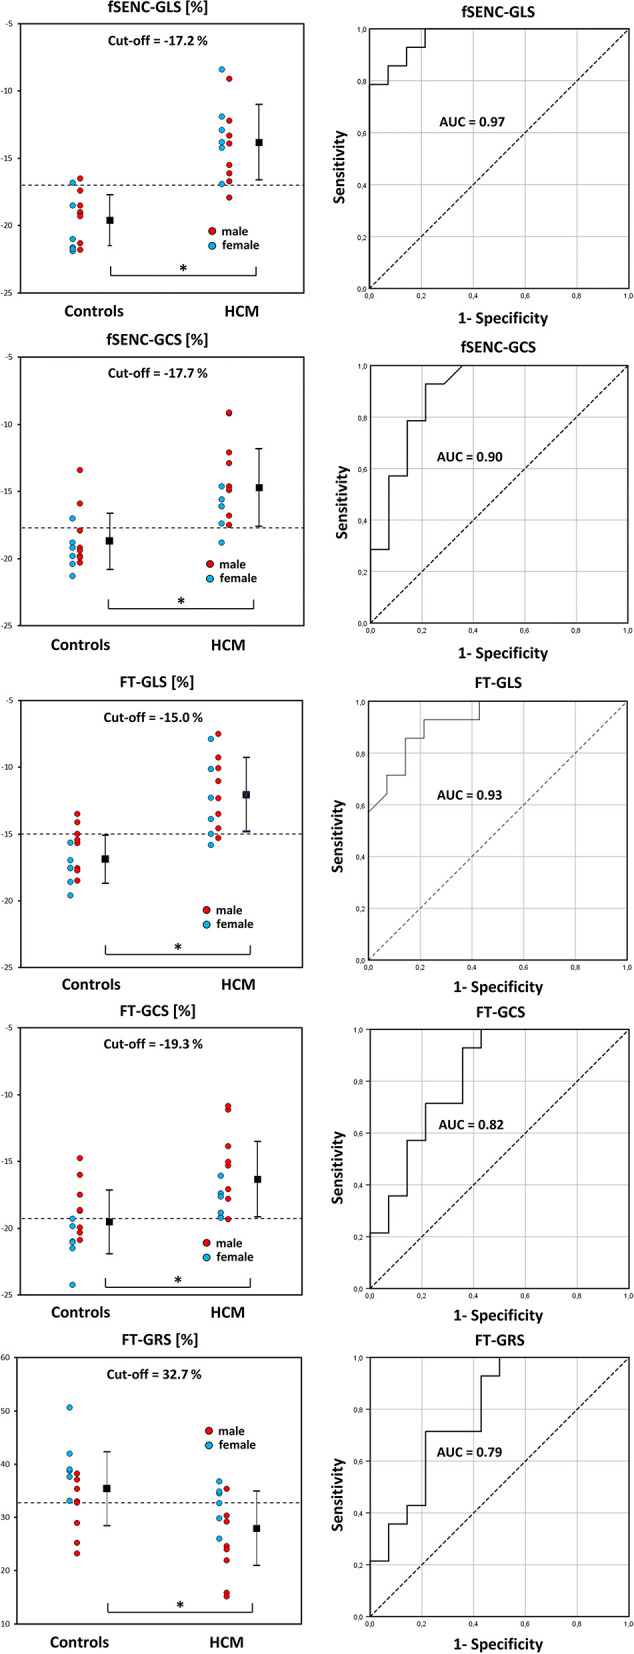
Figure 9.

DOT-charts with cut-off values (left) and ROC-curves with AUC values (right) for FT-GLS, FT-GCS and FT-GRS as well as for fSENC-GLS and fSENC-GCS. Mean ± standard deviation is indicated by bar graphs. GLS, global longitudinal strain; HCM, hypertrophic cardiomyopathy. *statistically significant with p < 0.05.
