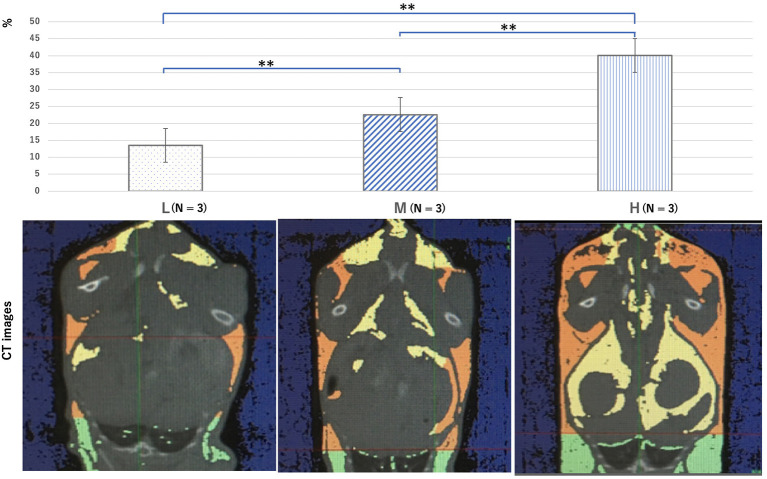
Figure 3.
Computed tomography images showing a cross-section of the chest and abdomen, which were used to analyze the body fat percentage at 10 weeks for all groups. The yellow area shows visceral fat, the orange area shows subcutaneous fat, and the green area shows fatty tissue (not all were included in the fat percentage measured in this study). Groups L, M, and H denote low-fat, medium-fat, and high-fat diet-fed mice, respectively. Data were analyzed using Tukey–Kramer honestly significant difference test. **p < 0.01.

