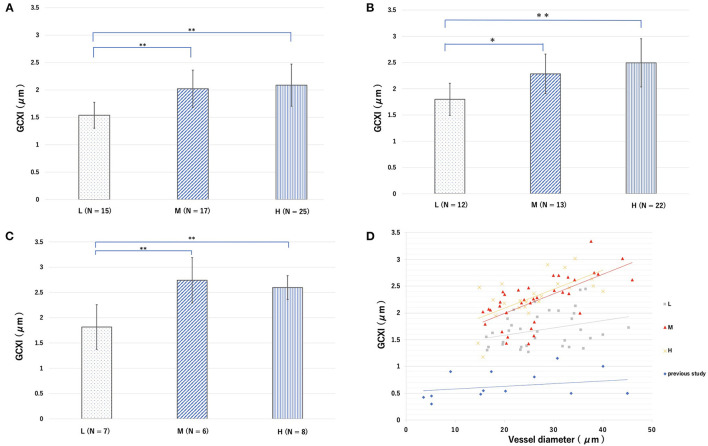
Figure 4.
Groups L, M, and H denote low-fat, medium-fat, and high-fat diet-fed mice, respectively. Average endothelial glycocalyx index (GCXI) for vessel diameters of (A) <25 μm, (B) 25–35 μm, and (C) >35 μm in each group. Data were analyzed using Tukey–Kramer honestly significant difference test. *p < 0.05, **p < 0.01. (D) Relationship between the GCXI and blood vessel diameter in each group in this study and from previous studies. Gray, red, and yellow markers and lines indicate L, M, and H, respectively, and blue markers and lines indicate data from previous studies.

