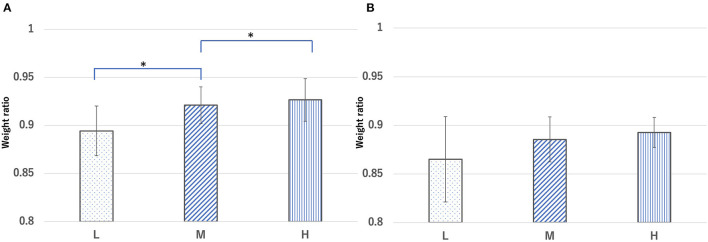
Figure 5.
Ratio of body weight in each group [ratio = body weight (A) 24 h and (B) 48 h after cecal ligation and puncture (CLP) to body weight before CLP]. Groups L, M, and H denote low-fat, medium-fat, and high-fat diet-fed mice, respectively. Data were analyzed using Tukey–Kramer honestly significant difference test. *p < 0.05.

