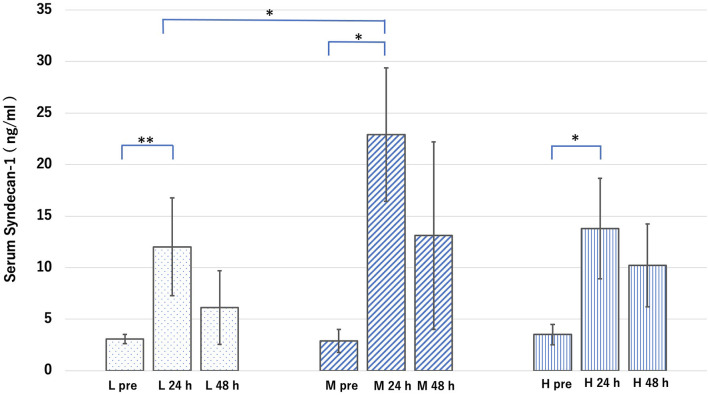
Figure 8.
Groups L, M, and H denote low-fat, medium-fat, and high-fat diet-fed mice, respectively. L pre is the average value of the blood concentration of syndical-1 (Sdc-1) before sepsis in Group L. L 24 h is the average value of the blood concentration of Sdc-1 24 h after sepsis in Group L. L 48 h is the average value of the blood concentration of Sdc-1 48 h after sepsis in Group L. The other groups are defined in the same manner. Serum concentration of Sdc-1 in each group before and after cecal ligation and puncture. Data were analyzed using Tukey–Kramer honestly significant difference test. *p < 0.05, **p < 0.01.

