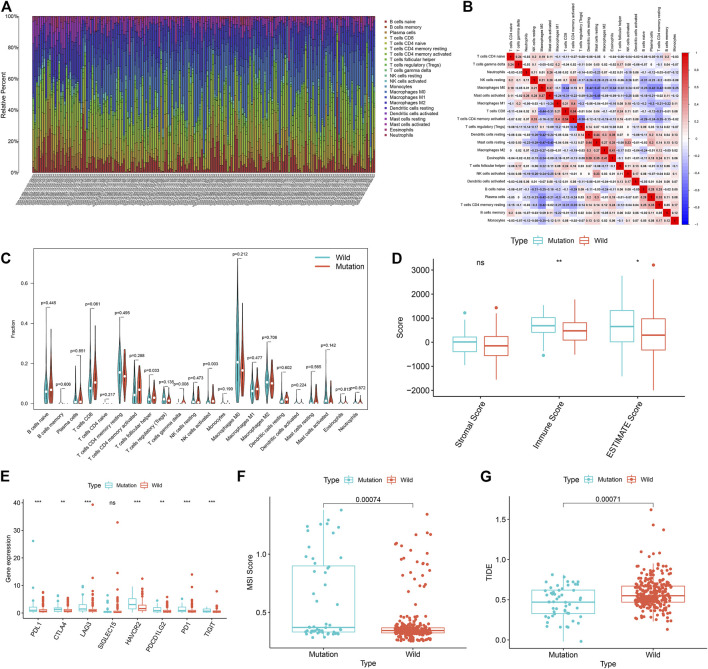
FIGURE 5.
USH2A mutation is associated with tumor immune cell infiltration and antitumor immunity. (A) The stacked bar chart shows the distribution of 22 immune cells in each sample. (B) Correlation matrix of immune cell proportions. The red color represents a positive correlation, and the blue color represents a negative correlation. (C) Violin plot displaying the differentially infiltrated immune cells between the USH2A-mutant groups and the wild-type USH2A group. (D) Immune score of USH2A mutant group and USH2A wild group samples. (E) Gene expressions of eight common immune checkpoints in USH2A mutant group and USH2A wild group samples. (F) MSI scores of samples from the USH2A mutant group and USH2A wild group. (G) TIDE scores of USH2A mutant group and USH2A wild group samples. ***p < 0.001, **p < 0.01, *p < 0.05, ns has no statistical difference. Green represents the USH2A wild group, and red represents the USH2A mutant group.

