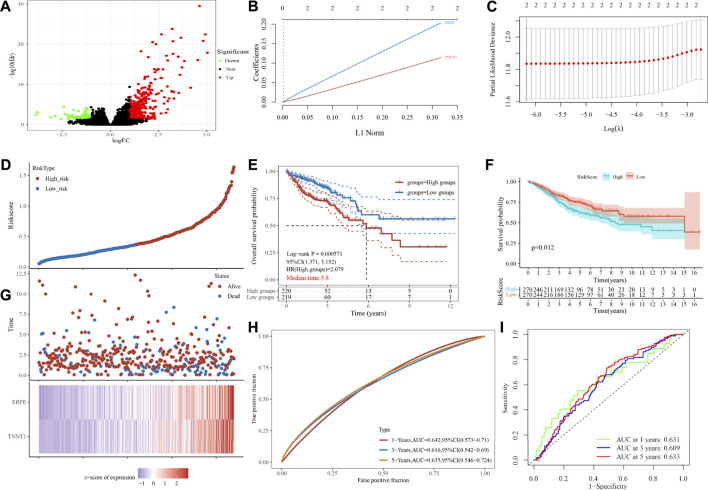
FIGURE 6.
Analysis of gene differential expression after USH2A mutation and construction of a prognostic model based on the differentially expressed genes after USH2A mutation. (A) Volcano map of gene differential expression analysis. (B) Constructing the lasso coefficient prediction model. (C) Selecting variables in lasso regression with minimum criteria by 1,000 times cross-validation. (D), (G) Risk plots for patients with higher and lower risk score. (E) Kaplan-Meier curve analysis of the high-risk and low-risk groups. (H) ROC curves of the risk score. (F) Kaplan-Meier curve analysis of the GSE39582 dataset based on risk model. (I) ROC curves of the risk score in the GSE39582 dataset based on risk model.

