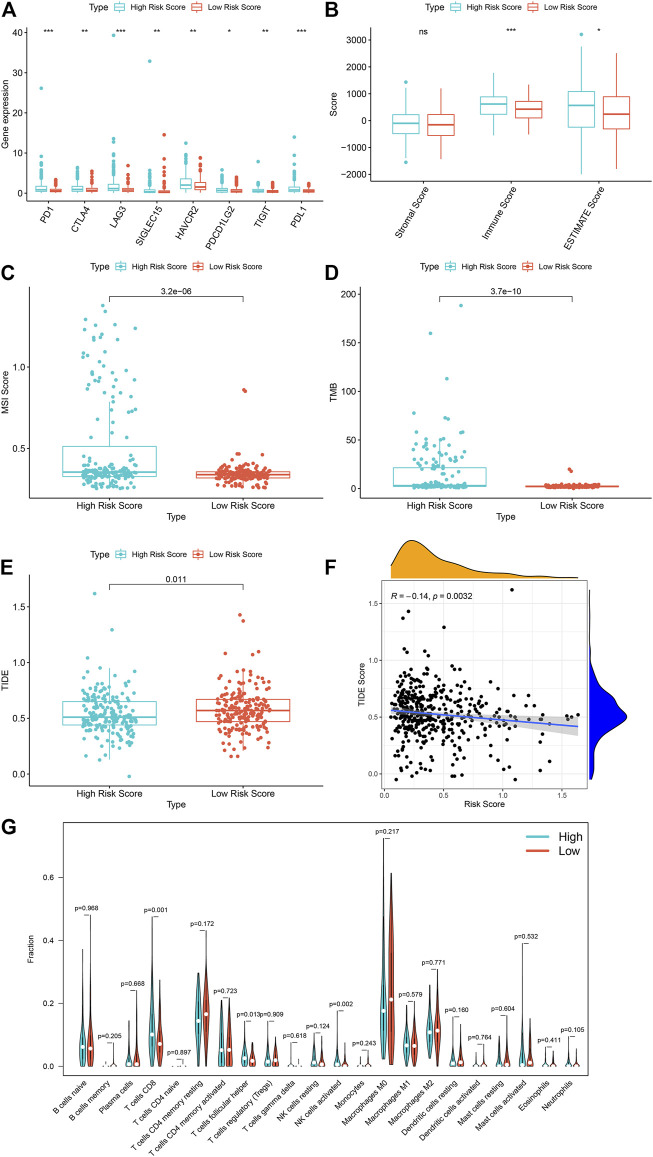
FIGURE 8.
The high risk score is associated with a better tumor immunotherapy response in TCGA sample. (A) The expression of immune checkpoint genes in TCGA samples in high and low risk groups. (B) The immune scores of the high and low risk groups of TCGA samples. (C) The MSI scores of the high and low risk groups of the TCGA sample. (D) TMB situation of high and low risk groups of TCGA sample. (E) TIDE scores of the high and low risk groups of the TCGA sample. (F) Correlation analysis between TCGA sample risk score and TIDE. (G) Differences in immune cell infiltration between high and low model scores. ***p < 0.001, **p < 0.01, *p < 0.05, ns, has no statistical difference. Green represents the high-scoring group of the model, and red represents the low-scoring group of the model.

