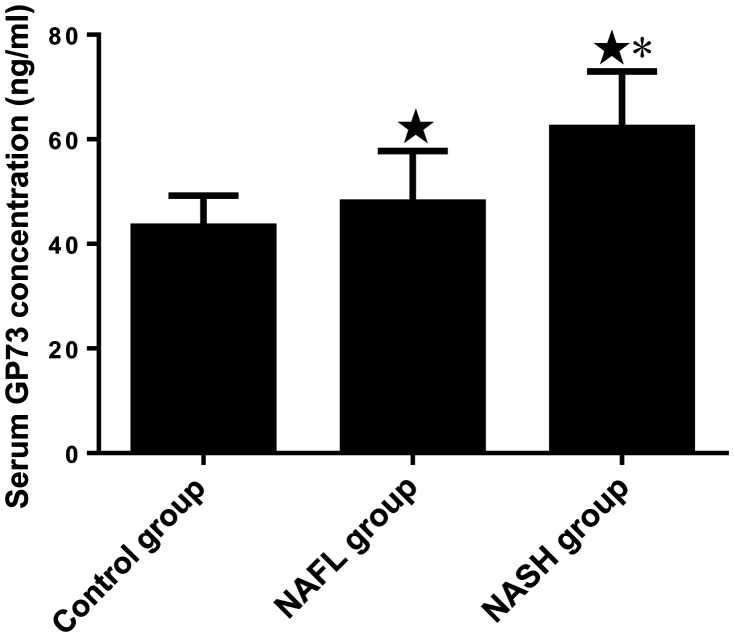
Figure 1.
Comparison of serum GP73 concentration in the control group and participants with NAFL disease at different clinical stages. ★P < 0.05 vs. the control group; *P < 0.05 vs. the NAFL group. N = 46, 45 and 30 for the NASH, NAFL and control groups, respectively.
GP, Golgi protein; NAFL, non-alcoholic fatty liver; NASH, non-alcoholic steatohepatitis.

