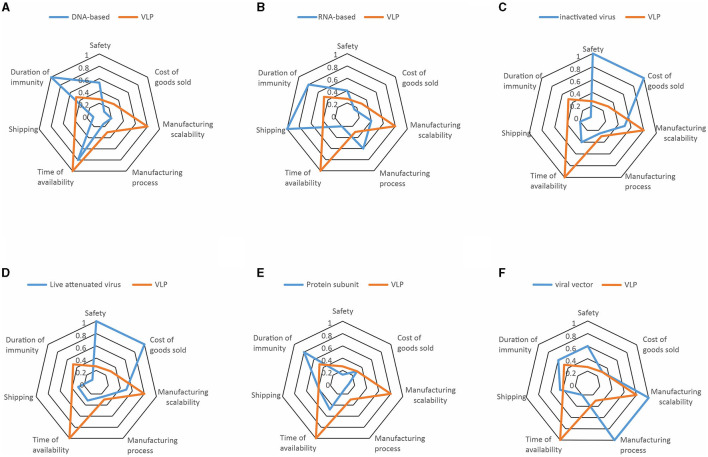
Figure 1.
The radar charts of the seven different vaccine technologies illustrating the major risks estimated by risk score, expressed in percentage. Risks represented are safety, cost of goods sold, manufacturing scalability, manufacturing process, time of availability, shipping, and duration of immunity. Each technology is represented in blue while being compared to virus-like particle (VLP) in orange. Risk associated to (A) DNA-Based, (B) RNA-based, (C) inactivated virus, (D) live attenuated virus, (E) protein subunit, and (F) viral vector vaccines are presented. The most important risks point toward 100, while less important risks point toward 0.

