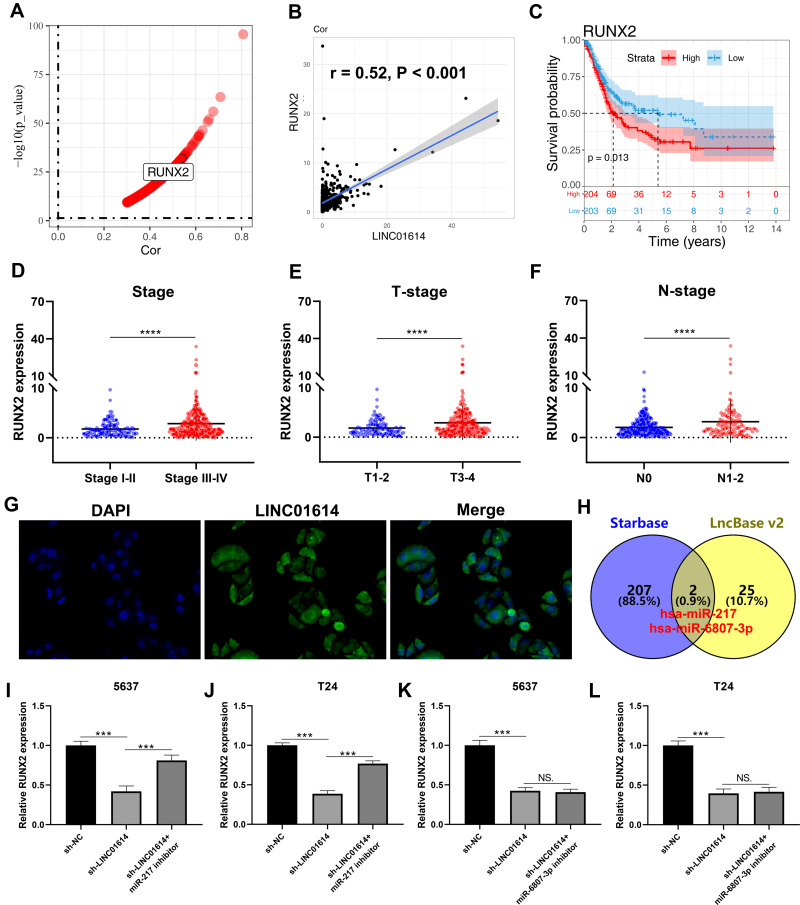
Figure 6.
Identification of RUNX2 as a target gene of LINC01614.
Notes: (A) Identification of the genes significantly correlated with LINC01614 with the threshold of |Cor > 0.3| and P< 0.01; (B) RUNX2 was positively correlated with LINC01614 (r= 0.52, P< 0.001); (C) Kaplan–Meier survival curve showed that the patients with high RUNX2 expression was associated with aworse prognosis; (D) the RUNX2 expression level in different clinical stage groups (stage I–II vs stage III–IV), ****P < 0.0001; (E) the RUNX2 expression level in different Tstage groups (T1-2 vs T3-4), ****P < 0.0001; (F) the RUNX2 expression level in different Nstage groups (N0 vs N1-2), ****P < 0.0001; (G) FISH assay showed that LINC01614 was mainly localized in the cytoplasm; (H) the intersection of Starbase and LncBase v2 identified two miRNA, miR-217 and miR-6807-3p; (I–L) qPCR results indicated that LINC01614 could regulate RUNX2 expression through miR-217, but not miR-6807-3p, NS. P> 0.05, ***P < 0.001.
Abbreviation: FISH, fluorescence insitu hybridization.

