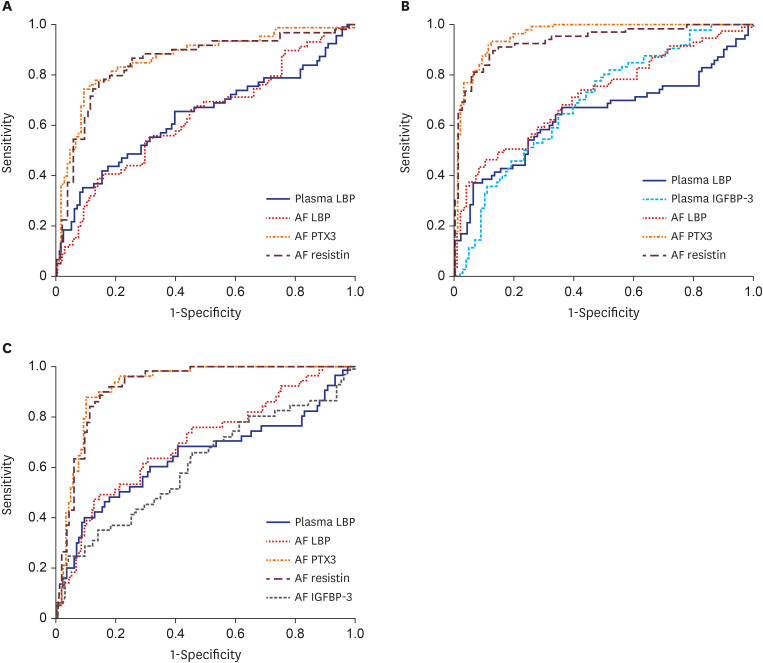
Fig. 1. (A) ROC curves of plasma LBP and AF LBP, PTX3, and resistin for predicting microbial invasion of the amniotic cavity. (B) ROC curves of plasma LBP and IGFBP-3, and AF LBP, PTX3, and resistin for predicting intra-amniotic inflammation. (C) ROC curves of plasma LBP and AF LBP, PTX3, resistin, and IGFBP-3 for predicting microbial-associated IAI.
LBP = lipopolysaccharide binding protein, AF = amniotic fluid, PTX3 = pentraxin 3, IGFBP = insulin-like growth factor-binding protein, ROC = receiver-operating characteristic.

