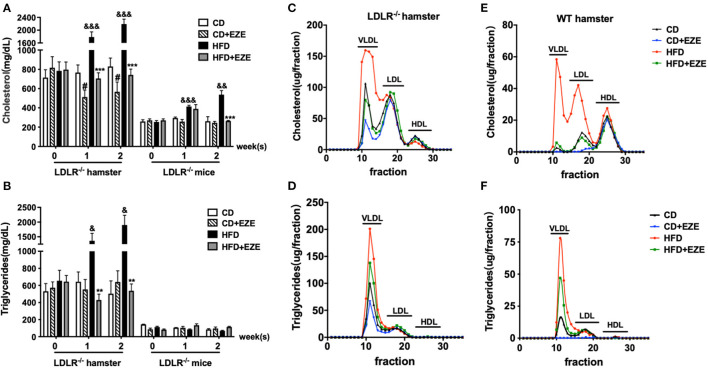
Figure 1.
The responses to high-fat diet (HFD) and ezetimibe (EZE) in hamsters and mice. Total cholesterol (A) and triglyceride (B) levels were determined from plasma collected after 2 weeks of HFD and EZE treatment from LDLR−/− hamsters (n = 10) and mice (n = 5). Data are shown as mean ± SEM. #p < 0.05 CD+EZE vs. CD; &p < 0.05, &&p < 0.01, &&&p < 0.001 CD vs. HFD; **p < 0.01, ***p < 0.001 HFD + EZE vs. HFD, where a two-way ANOVA with Tukey's multiple comparisons test was performed. Lipid profiles of LDLR−/− (C,D) and WT (E,F) hamsters. The plasma lipoprotein profile of hamsters 2 weeks after different treatments (CD, CD ± EZE, HFD, HFD ± EZE) was analyzed by FPLC. Each sample was of pooled plasma of five hamsters in each group, and 100 μL of the sample was loaded into the column. The cholesterol (upper) and triglycerides (bottom) of every collected fraction were determined and each data point was connected to make a curve on the graph. Each peak represents chylomicrons/VLDL, LDL, HDL fractions, respectively, from left to right.

