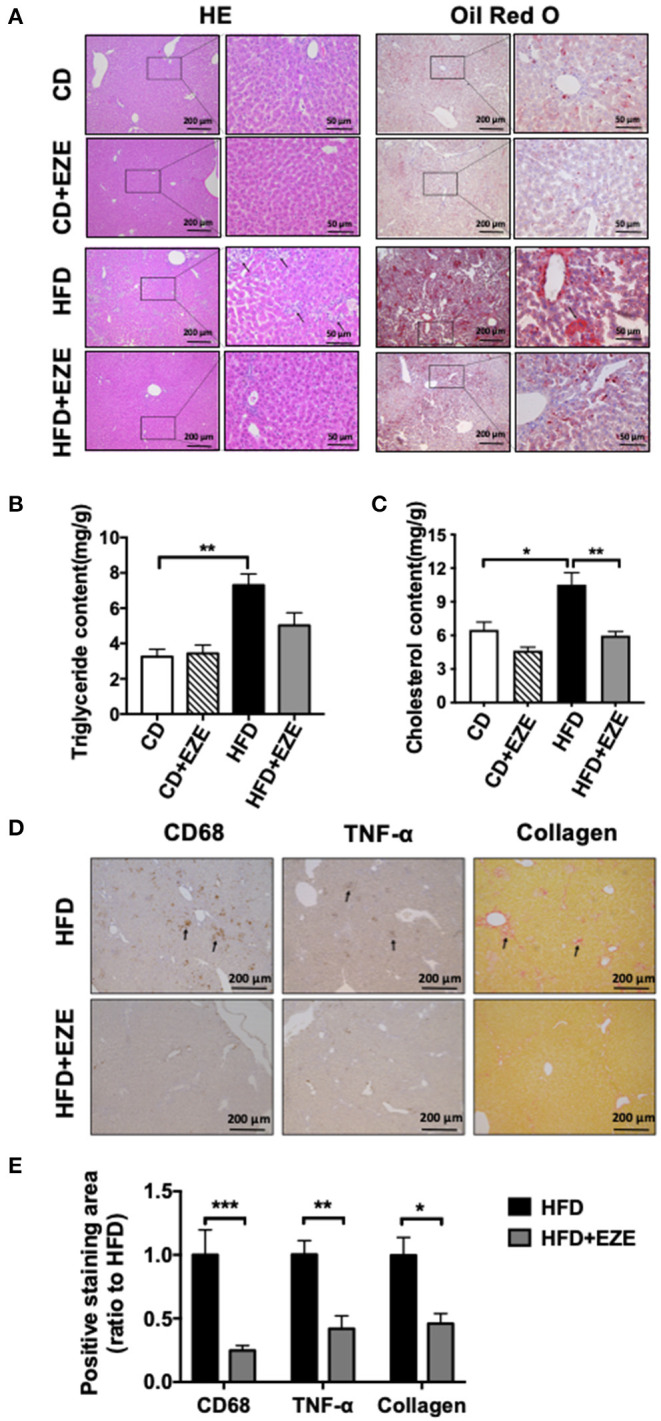
Figure 4.

Hepatic morphological analysis and lipid extraction. LDLR−/− hamsters were fed CD or HFD for 40 days and administrated with ezetimibe (+EZE) or solvent. (A) Representative images of liver cross-sections with H&E and oil red O staining. Scale bar = 200 or 50 μm, respectively. (B) Hepatic triglyceride content (n = 5), and (C) hepatic cholesterol content (n = 5). (D) Representative immunohistochemistry stained images of CD68 and TNF-α, and sirius red-stained images and (E) the relative quantization. Scale bar = 200 μm. Data are shown as mean ± SEM. Two-way ANOVA with Tukey's multiple comparison test, *p < 0.05, **p < 0.01, ***p < 0.001.
