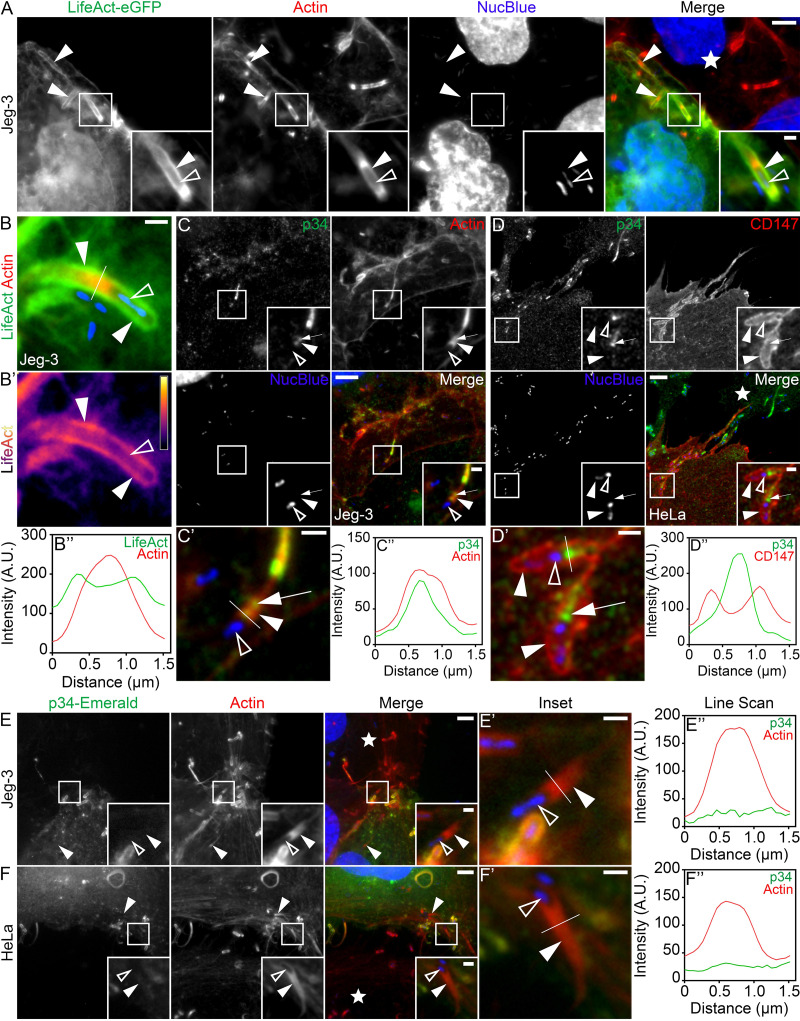
FIG 1.
The Arp2/3 complex does not localize to L. monocytogenes actin-rich membrane invaginations. (A) Mixed Jeg-3 cell assay showing LifeAct-eGFP (green) concentrated at bacterial membrane invaginations. Alexa Fluor 594-phalloidin (indicated as “Actin”; red) was used to visualize total F-actin (in both the protrusion-forming and invagination-forming cells) and NucBlue (blue) to visualize host DNA in addition to bacteria present within the invaginations. Bars, 5 μm and 1 μm (insets). (B to B’’) Line scan analysis of an L. monocytogenes membrane protrusion/invagination from samples stained with fluorescent phalloidin (indicated as “Actin”; red) to visualize total F-actin and NucBlue (blue) to confirm the presence of the bacteria at the structures. Intensity is shown in arbitrary units (A.U.). (B’) A heat map of the representative LifeAct signal from panel B (light yellow indicates the highest signal intensity). Bar, 1 μm. (B’’) A 1.5-μm line (white line) was drawn through the protrusion/invagination (see panel B). The total F-actin intensity (red) as well as the corresponding LifeAct intensity (green) was plotted. (C) Jeg-3 cells were infected with L. monocytogenes, fixed, and stained with p34/ArpC2 targeting antibodies (green), NucBlue (blue) to visualize host cell DNA and bacteria, and Alexa Fluor 594-phalloidin (red) to visualize F-actin. Insets shown are an enlargement of the boxed regions. Bars, 5 μm and 1 μm (inset). (C’ and C’’) Line scan analysis of the L. monocytogenes membrane protrusion/invagination from the merge inset in panel C. (C’) Enlargement of the inset shown in panel C. Bar, 1 μm. (C’’) A 1.5-μm line (white line) was drawn through the protrusion/invagination in panel C’, and the total F-actin intensity (red) as well as the corresponding p34/Arpc2 intensity (green) was plotted. (D) Mixed HeLa cell assay demonstrating that endogenous p34/ArpC2 (green) concentrates in the actin-rich core of bacterial membrane protrusions but not at membrane invaginations. The membrane invagination marker CD147-GFP (pseudo-colored red) is expressed solely in the membrane invagination-forming host cell. Samples were fixed and stained with NucBlue (blue) to visualize host DNA as well as any bacteria within the invaginations. Bars, 5 μm and 1 μm (inset). (D’ and D’’) Line scan analysis of the L. monocytogenes membrane protrusion/invagination from the merge inset in panel D. (D’) Enlargement of the inset in panel D. Bar, 1 μm. (D’’) A 1.5-μm line (white line) was drawn through the protrusion/invagination in panel D’, and the CD147-GFP intensity (red) as well as the corresponding p34/Arpc2 intensity (green) was plotted. (E) Mixed Jeg-3 cell assay demonstrating p34-Emerald (green) absence at L. monocytogenes membrane invaginations when expressed in the invagination-forming cells, Alexa Fluor 594-phalloidin (red) to visualize F-actin and NucBlue (blue) to visualize host DNA and bacteria within the invaginations. Bars, 5 μm or 1 μm (inset). (E’ and E’’) Line scan analysis of the L. monocytogenes membrane protrusion/invagination from the merge inset in panel E. (E’) Enlargement of the merge inset shown in panel E. Bar, 1 μm. (C’’) A 1.5-μm line (white line) was drawn through the protrusion/invagination in panel E’, and the total F-actin intensity (red) as well as the corresponding p34-Emerald intensity (green) was plotted. (F to F’’) The same as shown in panels E to E’’ but using HeLa cells in place of Jeg-3 cells. The white stars in the merge panels indicate the locations of the untransfected protrusion-forming host cells. All insets are enlargements of the boxed regions. Color intensities are enhanced in the insets to clearly visualize the labeled proteins. Solid arrowheads indicate the invagination, and open arrowheads indicate the spreading bacteria. Full arrows point to p34/ArpC2 present within the membrane protrusion actin-rich core.

