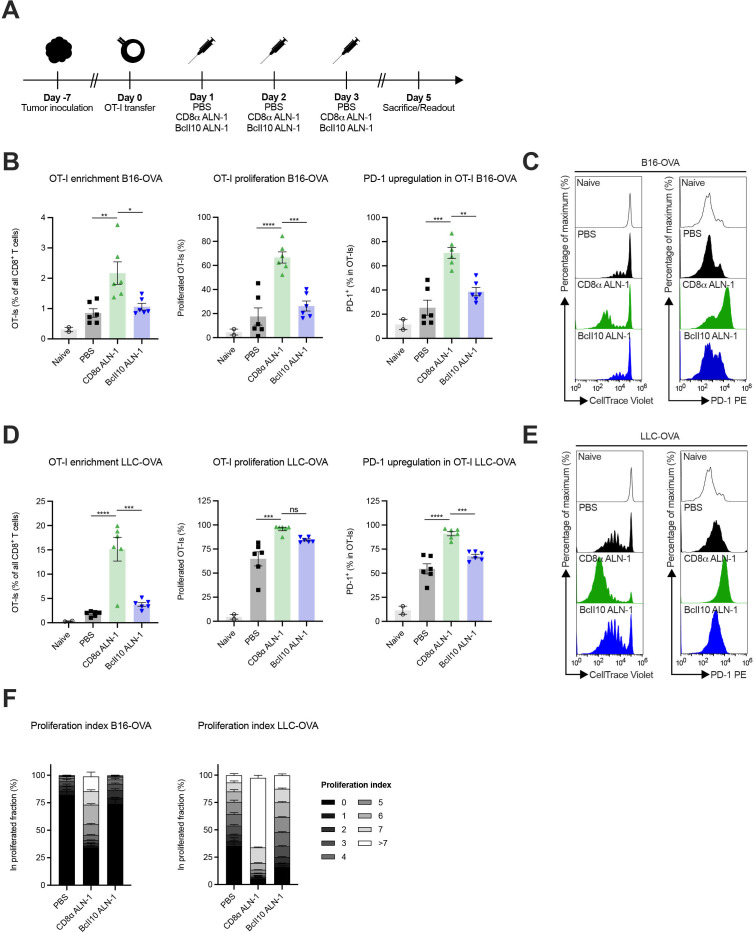
Figure 4.
Treatment with CD8α ALN-1 empowers activation and proliferation of adoptively transferred tumor-specific CD8+ T cells. (A) Mice inoculated with B16- or LLC-OVA received OT-I CD8+ T cells and treatments with PBS, CD8α ALN-1 (10 μg) or BcII10 ALN-1 (10 µg). (B–E) Frequencies of OT-I CD8+ T cells within the total CD8+ T cell population in TDLN (left), percentage of total proliferated OT-I CD8+ T cells (middle) and expression of PD-1 on OT-I CD8+ T cells (right) in B16- (B) and LLC-OVA (D) tumor-bearing mice. Bars represent the mean ± SEM of a representative of two independent experiments with n=2 (naive) or n=6 mice/group. Representative flow cytometry histograms displaying OT-I CD8+ T cell proliferation (left) and PD-1 upregulation (right) in TDLN of B16- (C) and LLC-OVA (E) tumor-bearing mice. (F) Stacked histograms summarize the proliferation index of OT-I CD8+ T cells in B16- (left) and LLC-OVA (right) tumor-bearing mice. Individual stacks represent the mean percentages of proliferating OT-I CD8+ T cells in certain stages of cell division ± SEM. Shown is a representative of two independent experiments with n=6 mice/group. *p<0.05, **p<0.01, ***p<0.001, ****p<0.0001; ns, p≥0.05 by one-way ANOVA with Tukey’s multiple comparisons test. See also online supplemental figures 6 and 7. ANOVA, analysis of variance; LLC, Lewis lung carcinoma; ns, not significant; OVA, ovalbumin; TDLN, tumor-draining lymph node.

