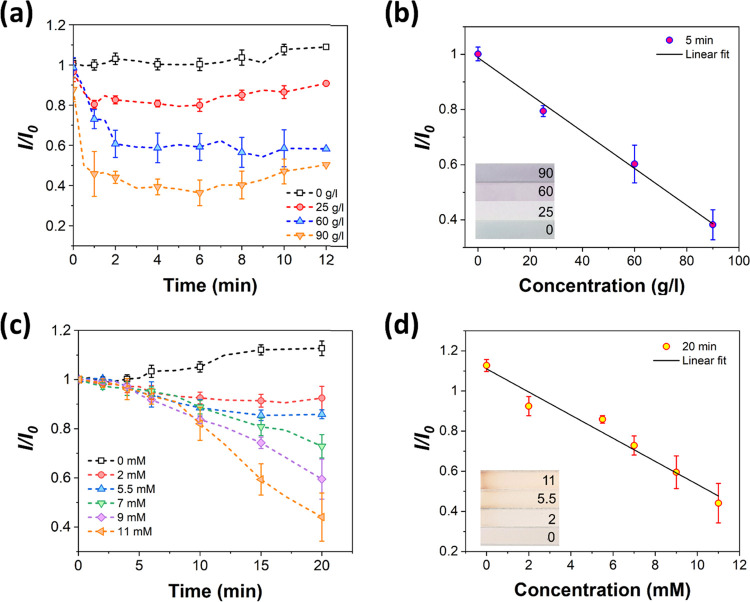
Figure 4.
Protein and glucose sensing on the printed channels: (a) normalized color intensity on the protein-sensing area at different BSA concentrations, (b) calibration curve for the protein assay (inset: color on the sensing areas at different concentrations, unit: g/L), (c) normalized color intensity on the glucose-sensing area at different concentrations, and (d) calibration curve for the glucose assay (inset: color on the sensing areas at different concentrations, unit: mM). Curves represent mean ± standard deviation from three parallel samples.

