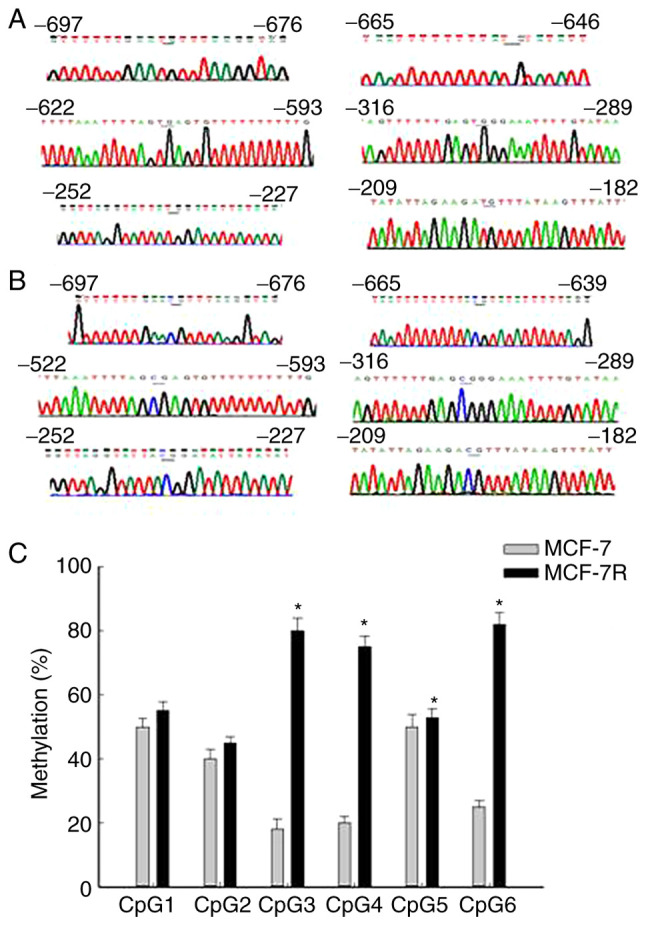
Figure 4.

Methylation levels across the NAT1 promoter region. Representative DNA sequencing of (A) completely unmethylated and (B) completely methylated samples of the NAT1 gene. All unmethylated cytosines were changed to thymine by bisulfite treatment, but no methylated cytosines were changed. The CpG sites are indicated by underlining. (C) Methylation levels across the NAT1 promoter region. Data are presented as mean methylation of each CpG unit ± standard deviation. Significant differences between the MCF-7 and MCF-7R cells were detected at CpG3, CpG4, CpG5 and CpG6. *P<0.05 vs. corresponding MCF-7. NAT1, N-acetyltransferase 1; MCF-7R, tamoxifen-resistant MCF-7 cells.
