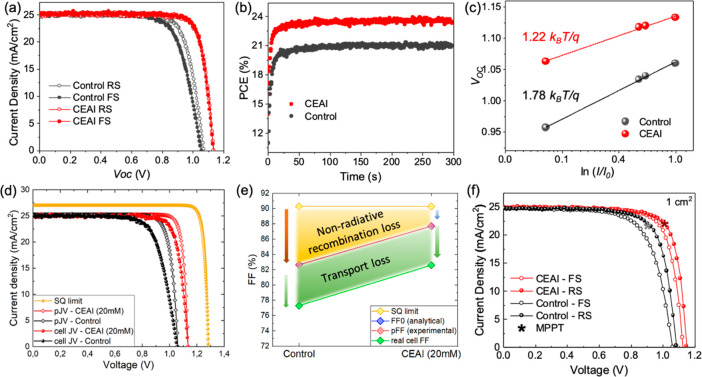
Figure 4.
(a) J–V curves of the control (black) and CEAI-treated (red) devices, where reverse scan (RS) and forward scan (FS) are indicated as open symbols and solid symbols, respectively. (b) Power output of the device employing CEAI treatment and the control devices at maximum power point as a function of time. (c) VOC versus logarithm of light intensity of the PSCs with and without CEAI treatment devices. (d) J–V curves of an ideal device with a bandgap of 1.56 eV limited only by the radiative recombination (Shockley–Quisser limit), pseudo-JV curves (constructed from the light-intensity-dependent VOC measurement) of cells with and without CEAI passivation, and their actual J–V curves (the area in between represents transport loss). (e) FF in the case of radiative limit for devices with this bandgap, theoretical FF (FF0) calculated from eq 1 and experimentally obtained pseudo-FF, both of which demonstrate the FF in the absence of charge transport losses, as well as the FF of the actual devices. (f) J–V curves of the champion 1 cm2 devices measured with the four-wire split method. The star indicates the JMPP and the VMPP after 60 s of MPPT.

