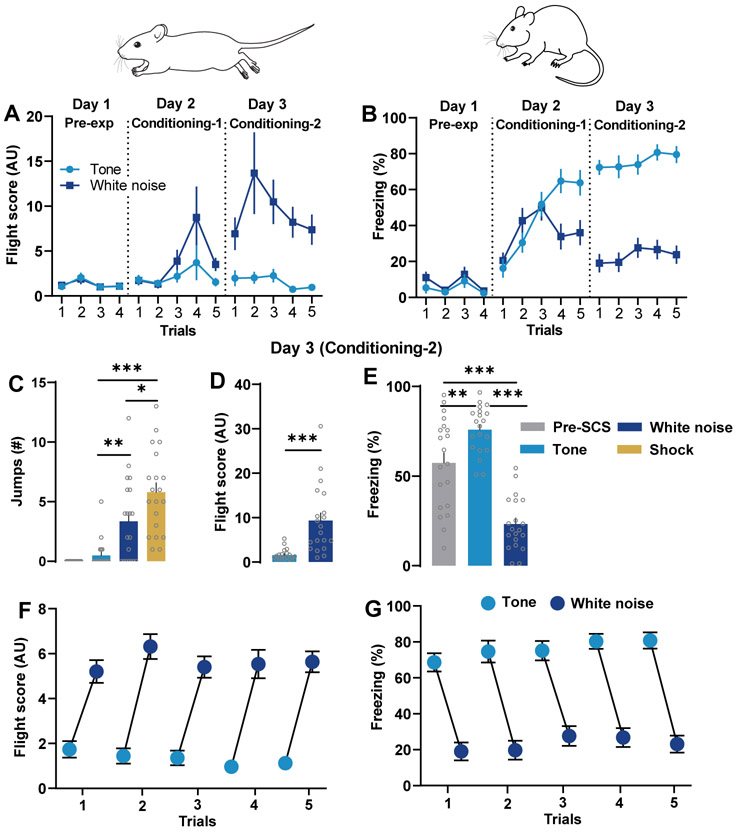
Figure 2:
Conditioned flight response. A) Comparison of average trial-wise flight scores (n = 20) following presentation of the tone and white noise across Days 1-3. A significant change in the flight scores across sessions have been noted (Day 1 to Day 3; two-way repeated measures ANOVA, cue × trial interaction, F (13, 266) = 5.795; P<0.0001). Post-hoc Bonferroni’s multiple comparison test reveals a significant difference between tone and white noise induced flight scores at fear conditioning Day 1 (trial 4, P < 0.05) and Day 2 (trials 2-5, P < 0.001). B) Comparison of average trial-wise % freezing during the tone and white noise periods across Days 1-3. Note a statistically significant changes in % freezing across the sessions (Day 1 to Day 3, n = 20; two-way repeated-measures ANOVA, cue × trial interaction, F (13, 266) = 20.81; P < 0.001; Fig. 2B). Post-hoc Bonferroni’s multiple comparison test reveals a significant difference between tone and white noise induced freezing at fear conditioning Day 1 (trial 4 and 5, P < 0.001) and Day 2 (all trials, P < 0.001). C) Comparison of number of jump escape responses in during the pre-SCS, tone, white noise, and shock periods on Day 3. One-way ANOVA followed by Bonferroni's multiple comparisons test showed that escape jumps were significantly higher during white noise and shock as compared to tone period (P < 0.01 and P < 0.001, respectively). D) Comparison of flight scores during the presentation of tone and white noise on Day 3. Note a significantly higher flight scores on Day 3 during white noise period (P < 0.001, Wilcoxon matched-pairs signed-rank test). E) Comparison of % freezing during the pre-SCS, tone, and white noise on Day 3. Moreover, freezing behavior on Day 3 reveals significant effect of tone and white noise (one-way repeated-measures ANOVA, F = 56.82, P<0.01). Bonferroni's multiple comparisons test showed that presentation of tone significantly increases % freezing vs pre-SCS duration (P < 0.01), whereas % freezing was significantly reduced as compared pre-SCS and tone durations (both P < 0.001). The representative trial-wise data shows transitions of flight (F) and freezing (G) behavior following the presentation of tone and white noise in the mouse on Day 3. The represented values are means ± SEM. *p<0.05, **p<0.01, ***p <0.001. Pre-exp, Pre-exposure. Panels A-E are modified from Fadok et al., 2017.

