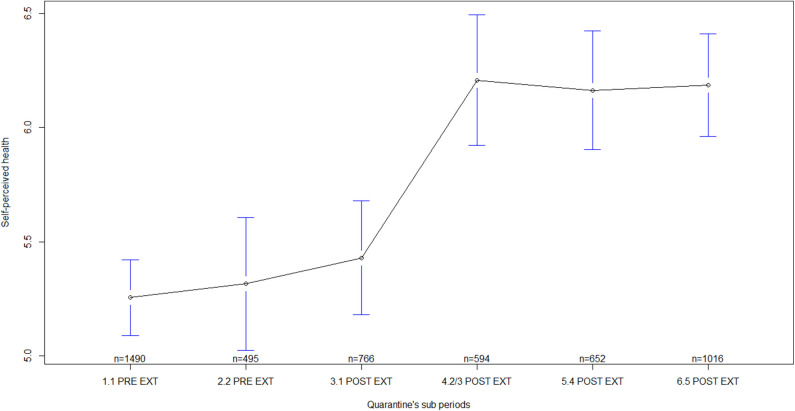
Figure 1.
Self-perceived health by quarantine sub-periods. Mean plot with 95% confidence interval. Self-perceived health as measured by the General Health Questionnaire (scores from the entire scale), in which higher scores indicate worse self-perceived health. 1.1 PRE EXT = First week of quarantine before extension, including participants answering during 17–23 March 2020; 2.2 PRE EXT = Second week of quarantine before extension, including participants answering during 24–29 March 2020; 3.1 POST EXT = Sub-period after the first quarantine extension, including participants answering during 30 March to 10 April 2020; 4.2/3 POST EXT = Sub-period after the second quarantine extension and including the third extension, with participants answering during 11 April to 08 May 2020; 5.4 POST EXT = Sub-period after the fourth quarantine extension, including participants answering during 09–23 May 2020; 6.5 POST EXT = Sub-period after the fifth quarantine extension, including participants answering during 24 May to 04 June 2020.

