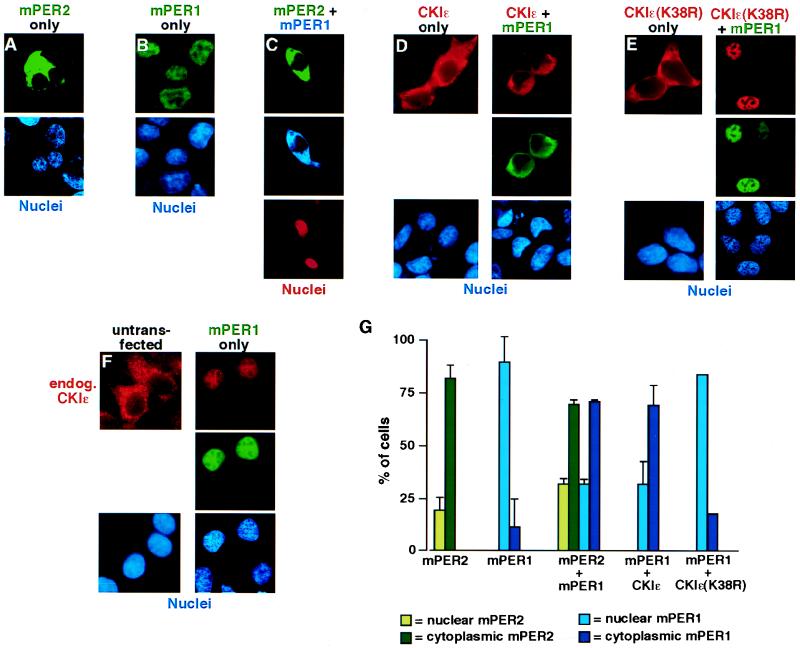
FIG. 3.
mPER2 and CKIɛ regulate mPER1 subcellular localization. (A to F) Representative micrographs illustrating subcellular localization of mPER2, mPER1, and CKIɛ. HEK 293 cells were transiently transfected with constructs encoding FLAG-mPER2 (A). Myc-mPER1 (B), FLAG-mPER2 and Myc-mPER1 (C), HA-CKIɛ without (D, left) or with (D, right) Myc-mPER1, HA-CKIɛ(K38R) without (E, left) or with (E, right) Myc-mPER1, and Myc-mPER1 (F). Forty-eight hours after transfection, the cells were fixed and epitope-tagged proteins were visualized by staining with Alexa 488 (green)-conjugated anti-FLAG (M2) (A and C), Alexa 350 (blue)-conjugated anti-Myc (9E10) (C), Alexa 488 (green)-conjugated MAb 9E10 (B, D, E, and F), Alexa 594 (red)-conjugated anti-HA MAb 12CA5 (D and E), and anti-CKIɛ MAb followed by an Alexa 594-conjugated goat anti-mouse secondary (F). Nuclei were visualized with Hoechst stain (A, B, D, E, and F) or ToPro3 stain (red; C). (G) Quantitation of the experiments illustrated above. Each bar is the result of at least two independent experiments (±standard deviation) in which 40 to 100 cells were counted. All immunofluorescence experiments were done at least twice, but where error bars are omitted experiments were quantitated only once.

