
Fig. 2. Unimodal and bimodal cells.
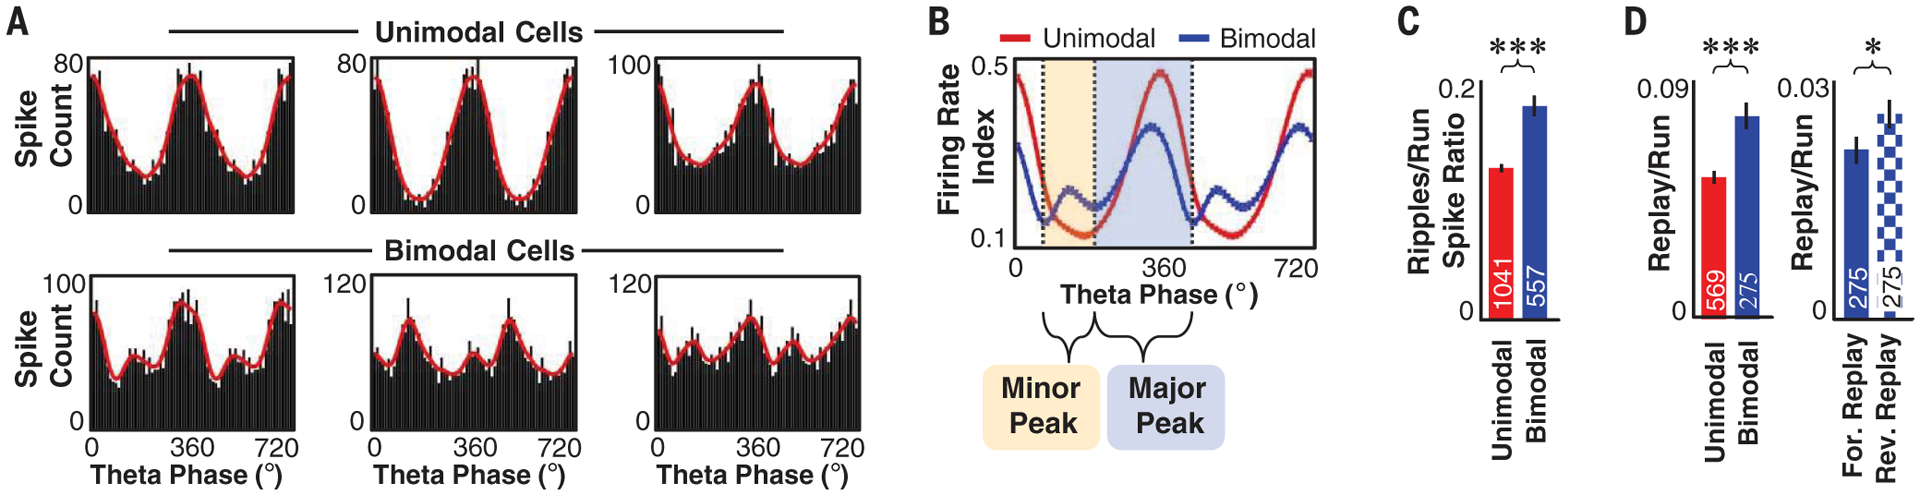
(A) Raw (black) and smoothed (red) histograms of action potential count per theta phase for example unimodal (top) and bimodal (bottom) cells. (B) Mean ± SEM firing rate index versus theta phase for all unimodal (red; n = 1041) and bimodal (blue; n = 557) cells across all open field and linear track sessions. Vertical lines mark troughs of mean firing for bimodal cells used to separate theta oscillations into major and minor peak windows. (C) Mean ± SEM ratio of spikes emitted across all ripples to spikes emitted during runs (velocity ≥10 cm/s) for unimodal or bimodal cells across all sessions. (D) (Left) Mean ± SEM ratio of spikes in significant replay events to spikes during runs for unimodal or bimodal cells across all linear track sessions. (Right) Mean ± SEM ratio of spikes in forward (solid) or reverse (checkered) replay to spikes during runs for bimodal cells across all linear track sessions. *P < 0.05, ***P < 0.001; Student’s t test; cell number (n) is listed on the bar graphs.