
Fig. 4. Cit-Vim exposure induces a more invasive subtype of fibroblast and enhances the expression of collagen and α-SMA.
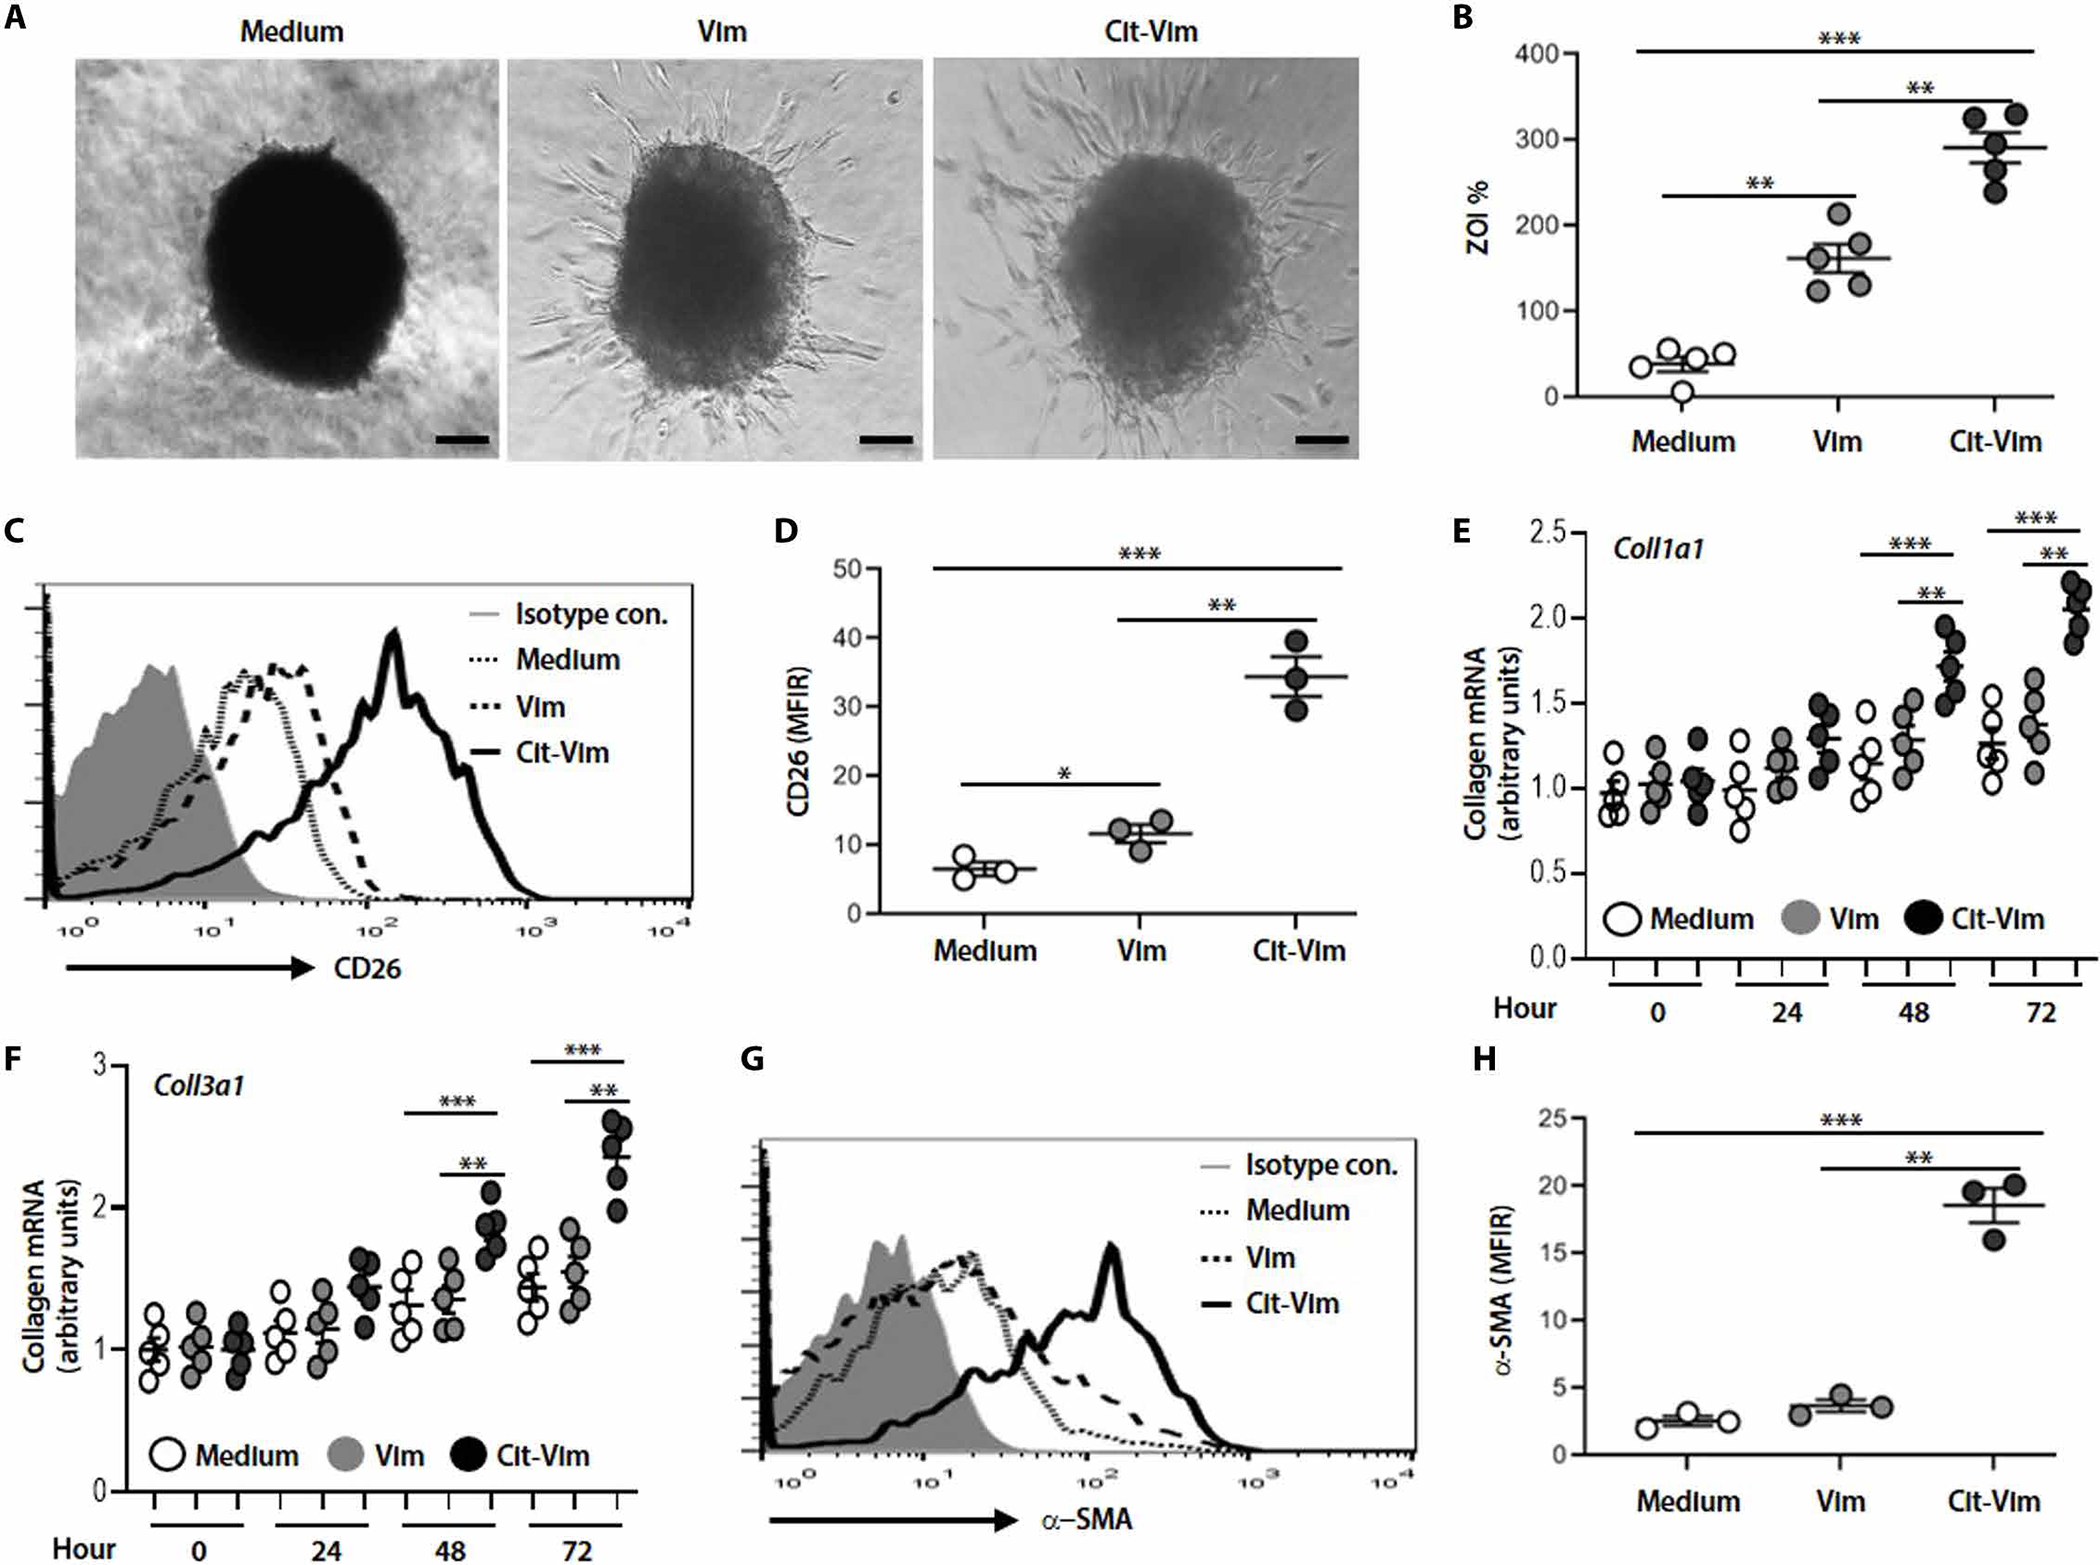
Primary human lung fibroblasts (5 × 10⁵/ml) isolated from normal subjects were incubated with Vim or Cit-Vim (2 μg/ml). (A) Representative phase-contrast images of pulmospheres from normal human lung (n = 5) with Vim or Cit-Vim for 12 hours. Scale bars, 250 μm. (B) Invasiveness of pulmospheres evaluated using the percentage of ZOI. Each dot represents each subject indicated by the mean value of ZOI from six lung pulmospheres. (C) Representative histograms on flow cytometry showing expression of CD26. (D) Quantification of CD26 expression in (C) using the mean fluorescence intensity ratio (MFIR) calculated by dividing the MFI of medium (dot line), Vim (dashed line), or Cit-Vim (solid line) by the MFI of isotype control (gray-filled histogram). (E) Col1α1 and (F) Col3α1 mRNA expression in fibroblasts stimulated with Vim or Cit-Vim. Data are representative from three individual subjects. (G) Representative histogram on flow cytometry showing expression of α-SMA. (H) Quantification of α-SMA expression in (G) using MFIR as shown in (D). *P < 0.05, **P < 0.01, and ***P < 0.001 using one-way ANOVA followed by Tukey’s post hoc analysis.