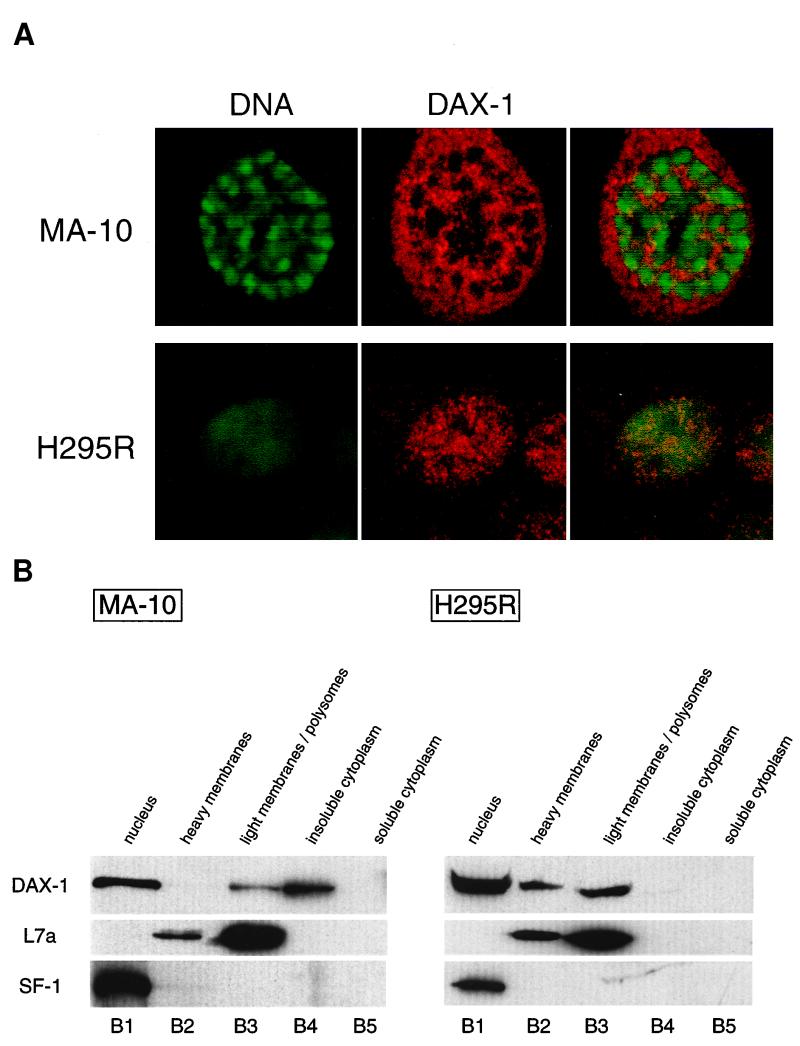
FIG. 1.
Subcellular localization of DAX-1. (A) Confocal microscopy analysis of DAX-1 distribution in steroidogenic mouse MA-10 Leydig cells (top) and human adrenocortical H295R cells (bottom). DNA is shown in green, and DAX-1 is in red. (B) Fractionation of H295R and MA-10 cell extracts on a discontinuous sucrose gradient (10). Proteins from the nuclear (B1), heavy membrane (B2), light membrane-polysome (B3), insoluble cytoplasm (B4), and soluble cytoplasm (B5) fractions were run on an SDS–10% PAGE gel and transferred to nitrocellulose. The membrane was sequentially probed with the anti-DAX-1 (top), anti-L7a ribosomal protein (center), and anti-SF-1 (bottom) antibodies.

