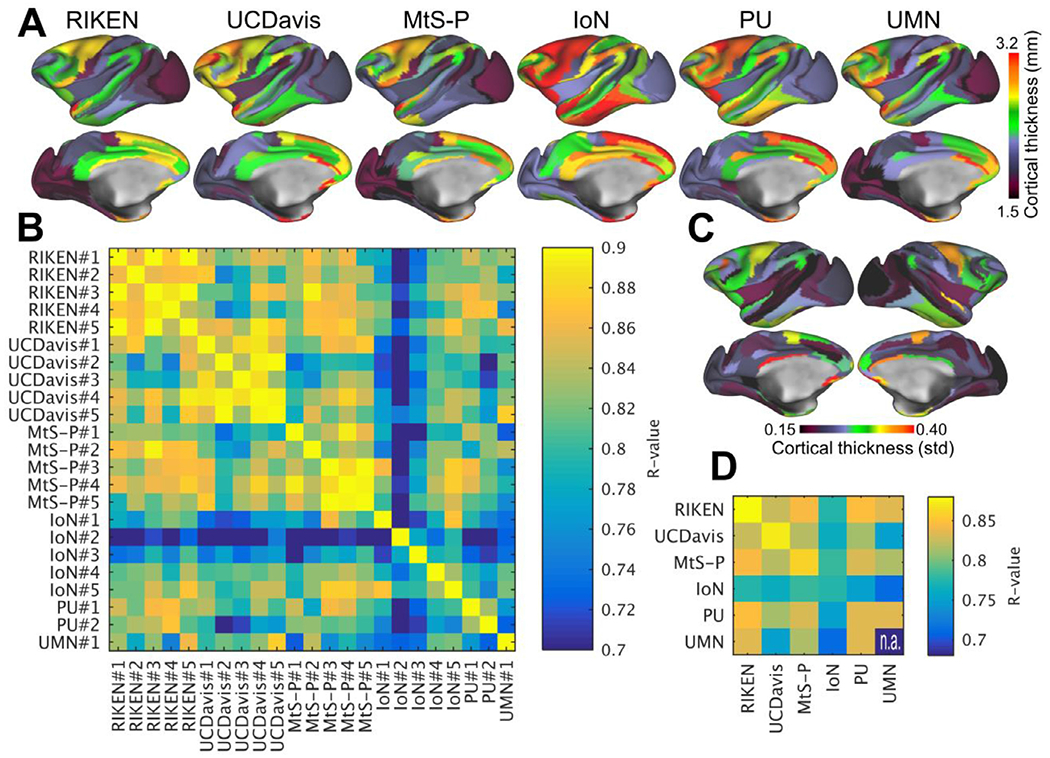
Fig. 2. Comparison of cortical thickness across exemplar subjects in the PRIME-DE.

(A) Top row shows exemplar parcellated curvature corrected cortical thickness maps from six PRIME-DE sites. (B) Comparison between cortical thickness maps across sites and subjects (N=23). (C) Variability of cortical thickness (N = 23). (D) Average correlation across and within imaging centers. Cortical thickness maps were automatically generated using HCP-NHP pipelines (Autio et al., 2020; Donahue et al., 2018), parcellated using M132 atlas containing 91 parcels per hemisphere (Markov et al., 2014) and then Pearson’s correlation coefficient between parcellated cortical thickness maps was calculated. Image resolution was 0.5 mm isotropic in all centers expect in UC-Davis resolution was 0.6 mm which was then reconstructed (zero padded) to 0.3 mm isotropic. Abbreviations RIKEN Institute of Physical and Chemical Research, Japan, UC-Davis University of California, Davis; MtS-p Mount Sinai-Philips; IoN Institute of Neuroscience; PU Princeton University; UMN University of Minnesota.
