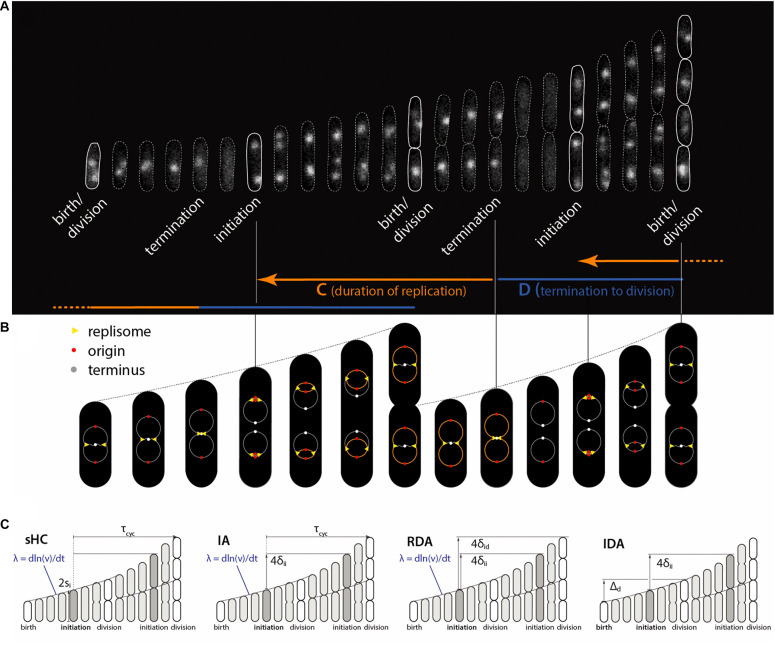
FIGURE 1.
Physiological parameters that can be measured from single-cell experiments. (A) Time-lapse images of a single Escherichia coli cell growing in a microfluidics channel. The cell boundaries are segmented from phase contrast images whereas the replication forks are visualized using a functional fluorescently labeled replisome protein (DnaN-YPet). (B) Multifork replication: in most growth conditions, several replication cycles overlap. The direction of the arrows is not the direction of time, but to illustrate that the HC model’s core idea is to trace replication initiation backward in time by C+D from division. (C) Four models of E. coli cell cycle and their control variables, which can be measured from single-cell experiments. The sHC model describes cell size and cell cycle using three parameters: elongation rate λ = dln(l)/dt, where l is the cell length (not shown), τcyc = C+D, and the initiation size per origin of replication si. The IA model uses λ, τcyc and the added size per origin of replication between consecutive replication initiation events δii. The RDA model uses λ, δii and the added size per origin of replication from initiation to division δid. The IDA model uses λ, δii and the added size from birth to division Δd. Note that both δid and τcyc can span multiple generations. The prefactor before si, δii, δid reflects multiple replication origins at initiation as depicted above.

