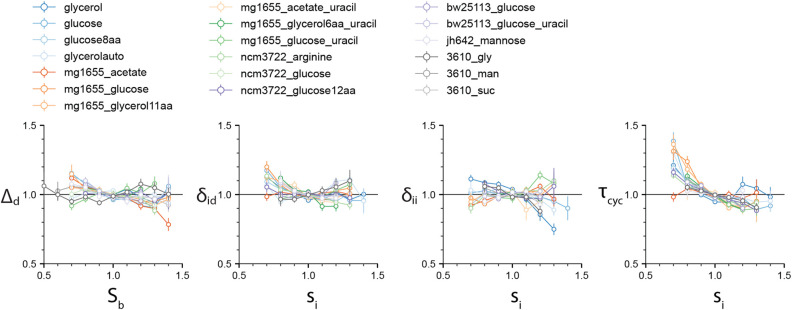
FIGURE 2.
The four correlations ρ(Sb, Δd), ρ(si, δid), ρ(si, δii), and ρ(si, τcyc) are computed for the 4 experimental datasets by Witz et al. (2019), and 15 experimental datasets that we produced (see Supplementary Methods). While the first three vanish for most experimental data, the ρ(si, τcyc) displays a consistent negative correlation, inconsistent with the sHC and IA models. Variables in each dataset were normalized by their mean. Numerical values for the Pearson correlation coefficients are given in Supplementary Data 2 file. Slopes can be inferred from the Pearson correlation coefficients and CVs in the approximation of bivariate Gaussian variables.

