
FIGURE 2.
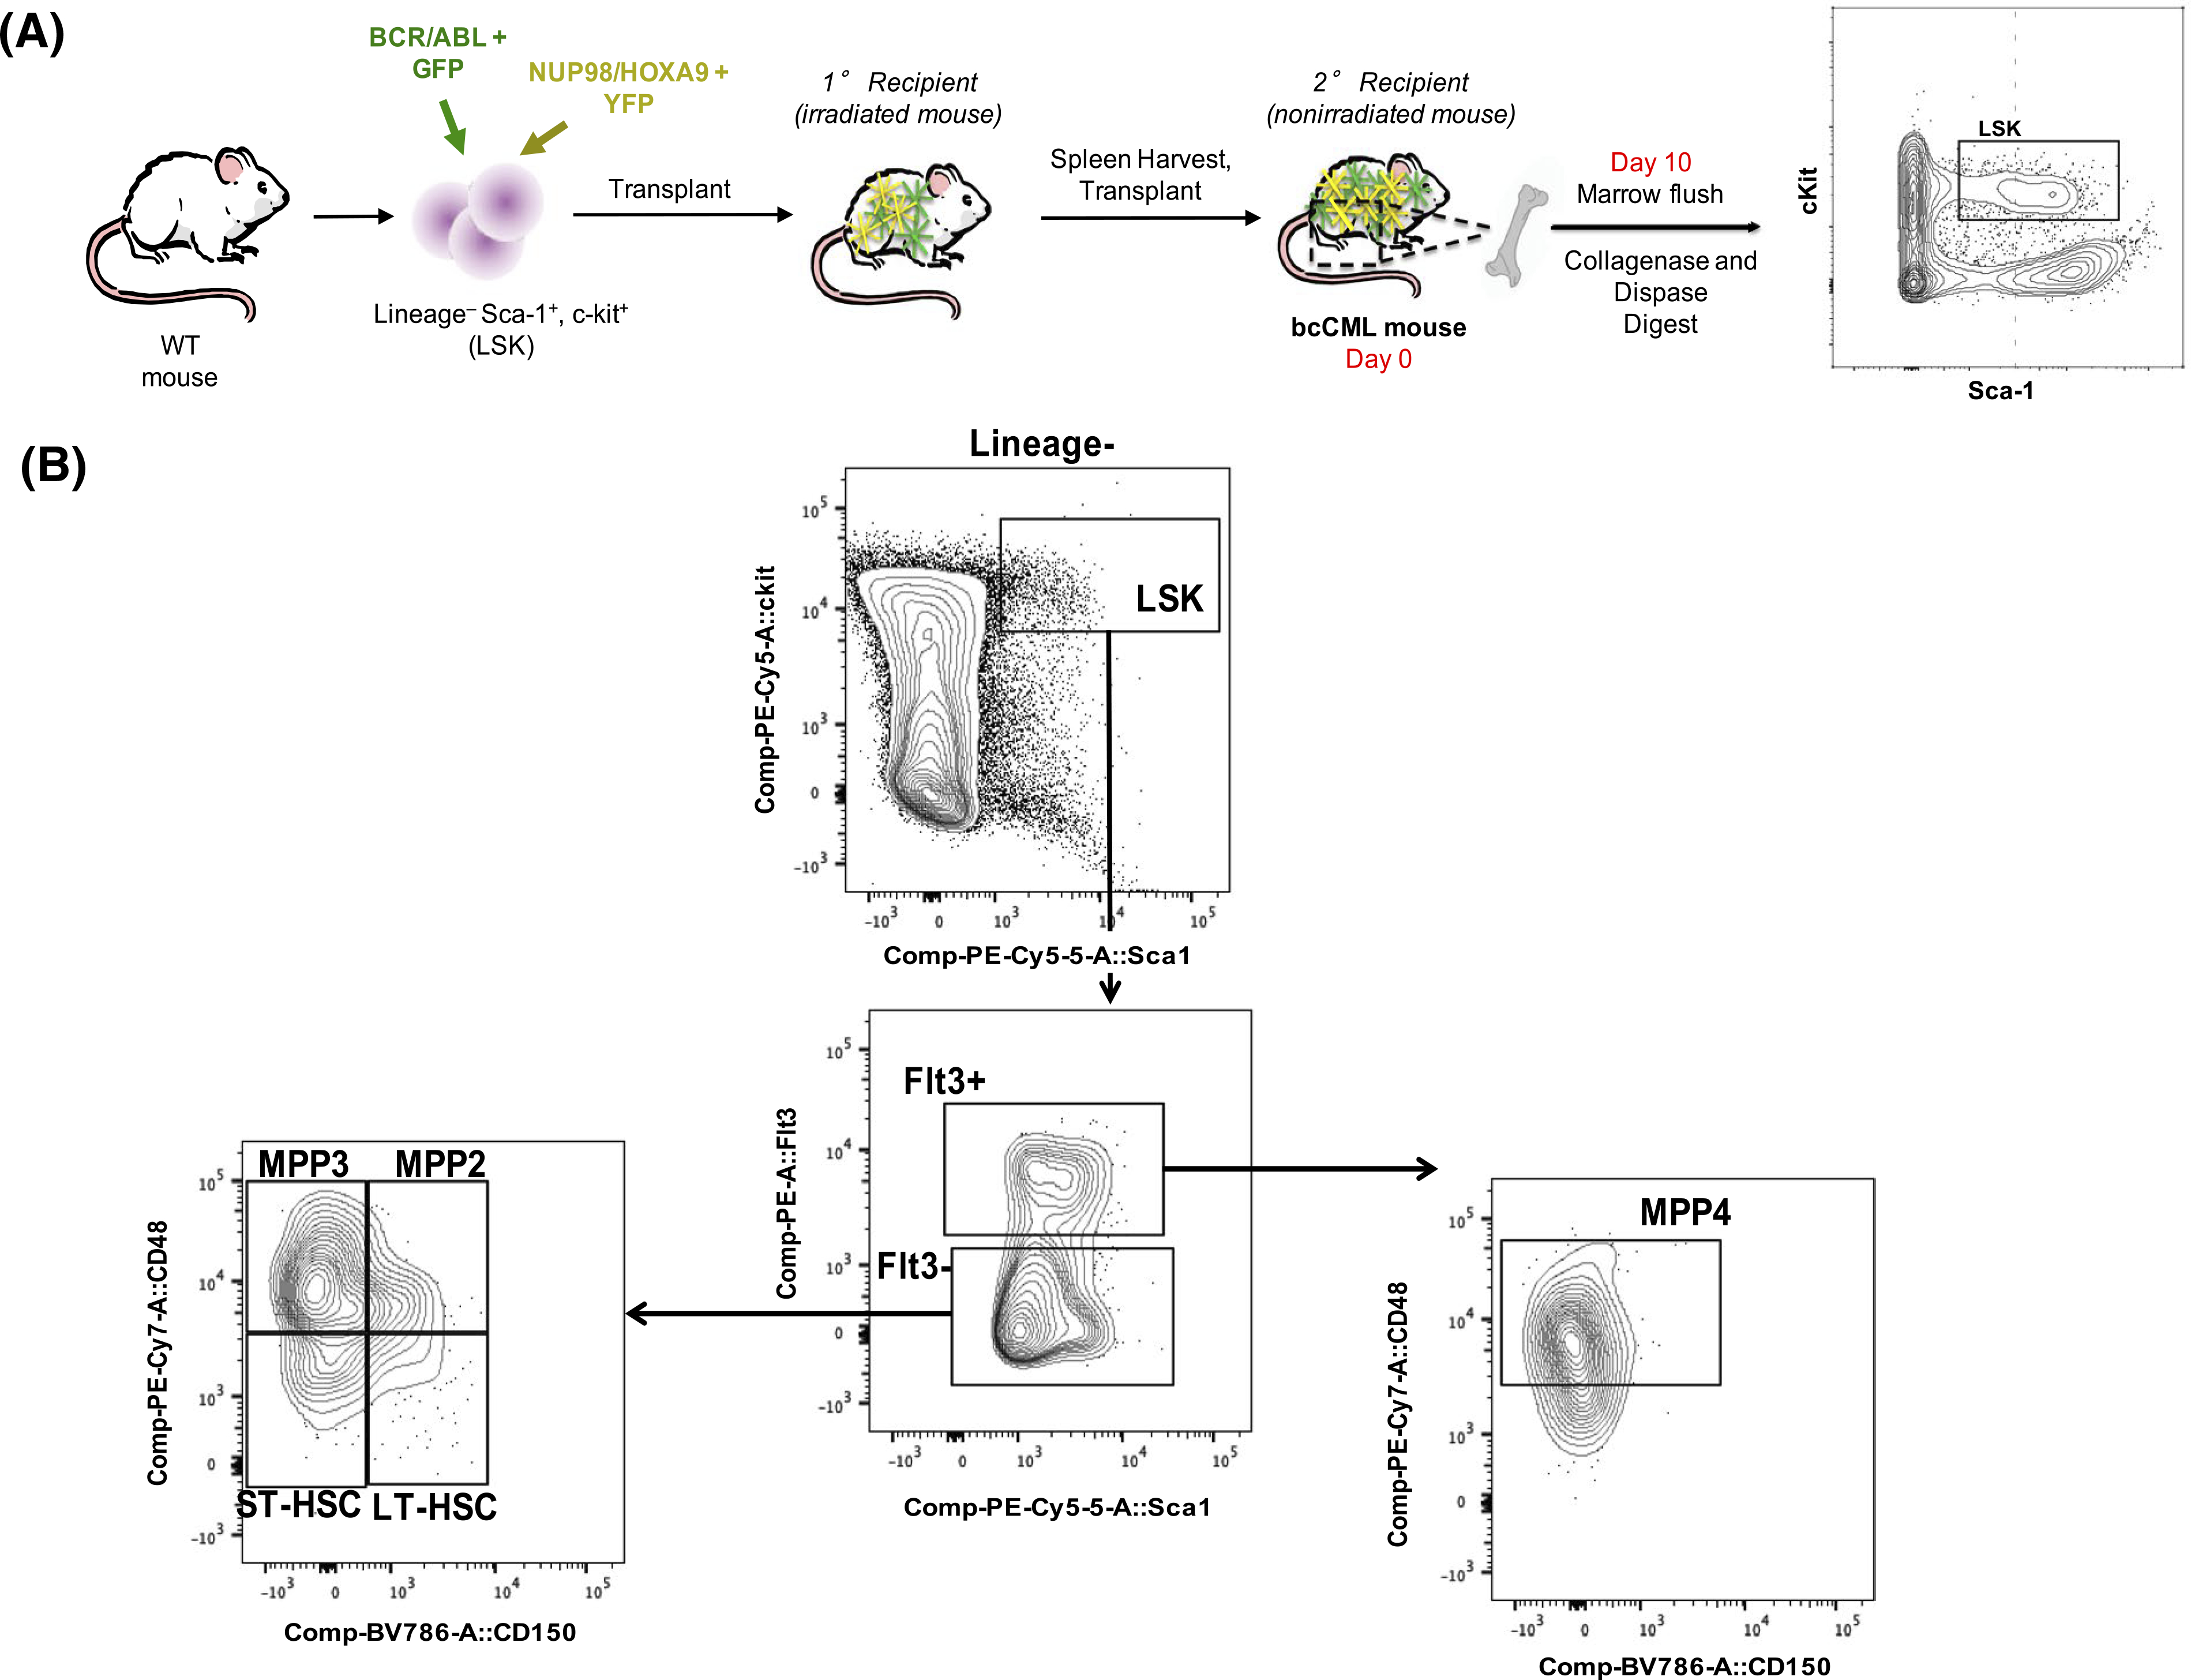
The hematopoietic system and BMME in bcCML mice are disrupted. A, Schematic of bcCML initiation and sample processing. B, Flow cytometry plots defining HSC and MPP populations. Flow cytometry analysis of marrow derived HSPCs demonstrates increases in LT-HSCs, ST-HSCs, MPP2, MPP3, and MPP4 populations at Day 10 post-engraftment. C, GFP+ marrow cells (D) GFP-LT-HSCs (E) GFP-ST-HSCs (F) GFP-MPP2 (G) GFP-MPP3. H, GFP-MPP4. I, Flow cytometry plots defining MSC populations. J, MSC population defined as CD45−/Lin−/CD31−/CD51+/140a+. Data represents mean ± SEM (n = 5–9). Unpaired two-tailed t-tests were performed. *P < .05 and ****P < .0001