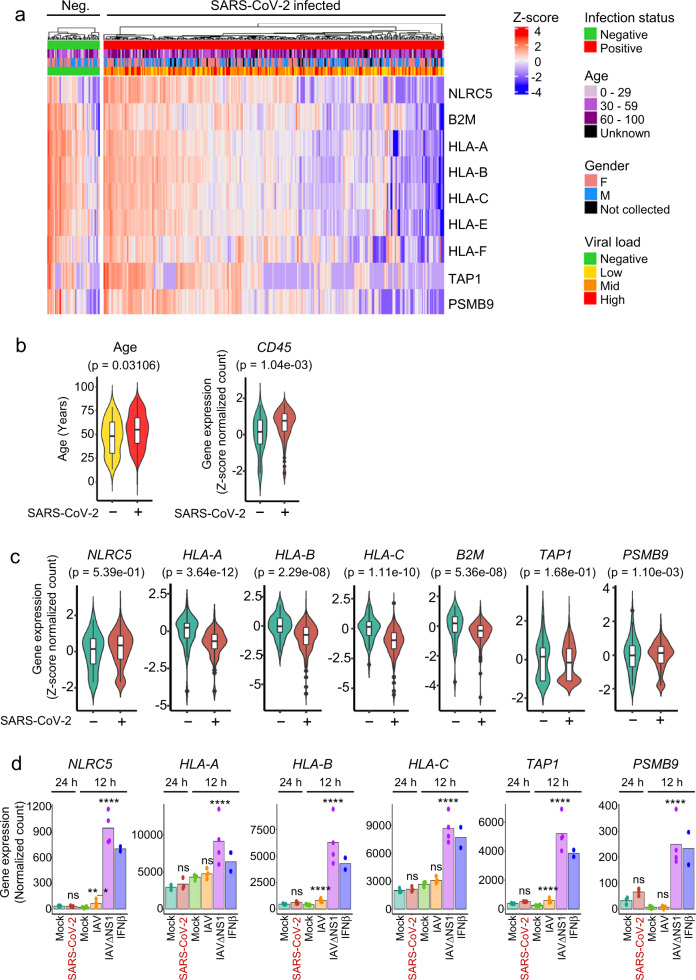
Fig. 1. Induction of MHC class I genes is suppressed during SARS-CoV-2 infection.
RNA-seq of nasopharyngeal swabs from SARS-CoV-2 negative (n = 46) or positive (n = 300) patients were controlled for similar expression of CD45 and evaluated for a MHC class I gene expression depicted by heatmap of z-score transformed log2 normalized count. b Age and CD45 comparisons between SARS-CoV-2 negative and positive patients from a. Boxplot center indicate medians with the lower and upper bounds of the box indicating the 25th and 75th percentiles. The upper and lower whiskers extend out 1.5 *IQR from the respective upper and lower bounds on the box. Two-sided Mann–Whitney U test P-values are depicted. c Violin plots for the expression of indicated MHC class I and related genes, comparing SARS-CoV-2 negative or low immune influx SARS-CoV-2 positive patients from a. Graphs show z-score transformed log2 normalized count compared to the SARS-CoV-2 negative group. Boxplots indicate medians ± IQR. Benjamini–Hochberg adjusted two-sided Wald-test p-values are depicted. d Normal human bronchial epithelial cells were infected with SARS-CoV-2 at a moi of 2 for 24 h or influenza A virus (IAV) or IAV lacking the NS1 gene (IAVΔNS1) at a moi of 3 for 12 h or 100 U/mL IFNβ for 12 h and evaluated for MHC class I gene expression by RNA-sequencing. Bars depict means. Benjamini–Hochberg adjusted two-sided Wald-test P-value: **P< 0.01; ***P < 0.001; ****P < 0.0001. n = 7 for mock, 3 for SARS-CoV-2, 4 for both IAV and IAVΔNS1, and 2 for IFNβ.

