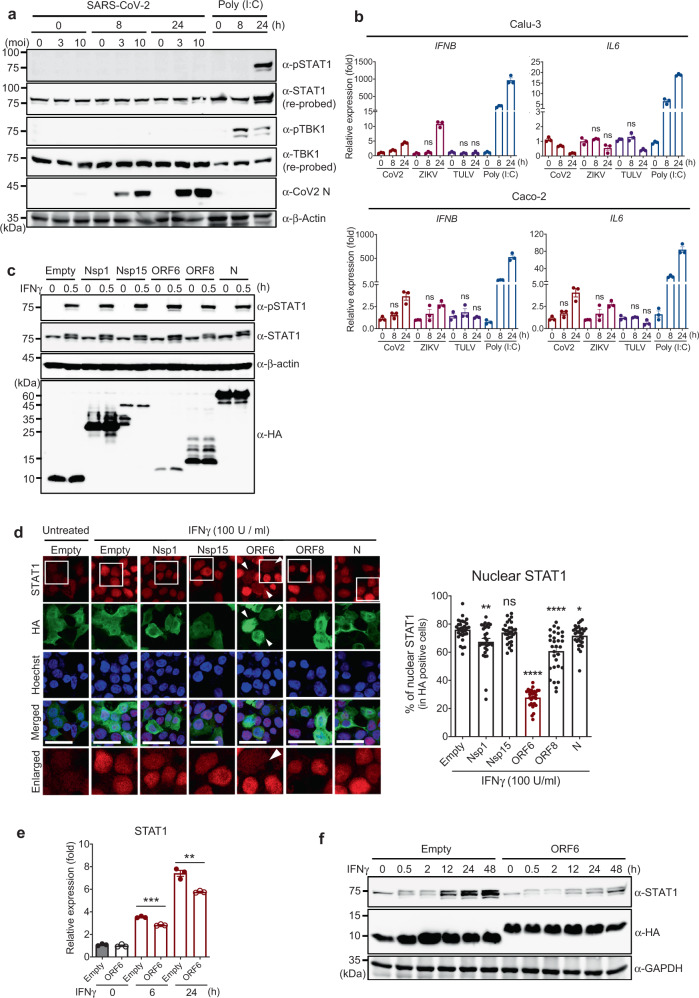
Fig. 3. SARS-CoV-2 ORF6 inhibits IFNγ-mediated STAT1 function.
a Immunoblot analysis of the indicated protein level in Calu-3 cells infected with SARS-CoV-2 at indicated moi or stimulated with poly(I:C) (200 ng) for the indicated time. The data shown is the representative result from two independent experiments. b Quantitative real-time PCR analysis of the indicated gene expression level in SARS-CoV-2 (moi 3), ZIKV (moi 10), and TULV (moi 5)-infected, or poly(I:C) (200 ng) transfected Calu-3 or Caco-2 cells for the indicated time. The results are from three independent experiments. c Immunoblot analysis of the indicated protein level in IFNγ (100 U/ml) treated HEK293T cells expressing the indicated SARS-CoV-2 proteins. The data shown is the representative result from two independent experiments. d Immunofluorescence analysis of endogenous STAT1 cellular localization in IFNγ (100 U/ml) treated HEK293T cells expressing the indicated SARS-CoV-2 proteins or empty control. Images were obtained using a confocal microscope. The scale bar indicates 50 microns. Suppressed STAT1 nuclear localization is indicated with white arrows. White boxes indicate the area shown in Enlarged row. Quantitative comparison of the nuclear STAT1 signal intensity (% of nuclear signal intensity/total cell signal intensity) is shown with a bar graph analyzed by ImageJ. e Quantitative real-time PCR analysis of STAT1 gene expression level in SARS-CoV-2 ORF6 expressing HEK293T cells stimulated with IFNγ (100 U/ml) for the indicated time. The results are from three independent experiments. f Immunoblot analysis of the indicated protein level in SARS-CoV-2 ORF6 expressing HEK293T cells stimulated with IFNγ (100 U/ml) for the indicated time. The data shown is the representative result from two independent experiments.

