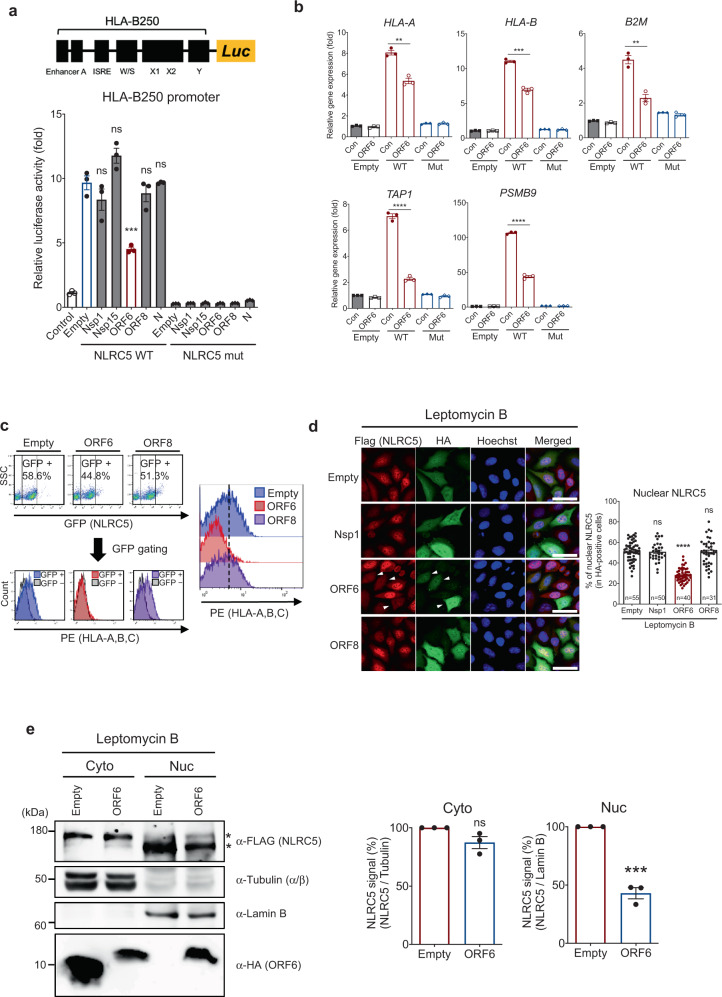
Fig. 5. SARS-CoV-2 ORF6 suppresses NLRC5 CITA function.
a Effect of SARS-CoV-2 proteins on NLRC5-mediated HLA-B promoter activity. The schematic image illustrates the reporter assay system for monitoring the promoter activity of HLA-B. HEK293T cells were transfected with HLA-B proximal promoter reporter construct and plasmids expressing WT or Walker A mutant NLRC5, along with a control plasmid, or with plasmids expressing the indicated SARS-CoV-2 proteins. At 36 h after transfection, cells were collected to measure the luciferase activity. The results are from three independent experiments. b Effect of SARS-CoV-2 ORF6 on NLRC5-mediated expression of the MHC class I-related genes in HEK293T cells analyzed by quantitative real-time PCR. The results are from three independent experiments. c Effect of SARS-CoV-2 proteins on NLRC5-mediated surface expression of HLA- A, B, and C in HEK293T cells analyzed by flow cytometry. GFP (NLRC5) positive cells were gated for evaluating PE (HLAs) signal intensity. The FACS gating strategies are provided in Supplementary Fig. 9. d Effect of SARS-CoV-2 proteins on the cellular localization of FLAG-tagged NLRC5 in leptomycin B (100 nM, 8 h) treated HeLa cells stably expressing FLAG-NLRC5 by immunofluorescence analysis. Representative images show reduced NLRC5 nuclear localization indicated with white arrows. Quantitative comparison of the nuclear NLRC5 signal intensity (% of nuclear signal intensity/total cell signal intensity) is shown with a bar graph analyzed by ImageJ. Images were obtained using a confocal microscope. The scale bar indicates 50 microns. The sample numbers for evaluation are indicated in the bar graph. e Immunoblot analysis of the indicated proteins from the cell lysates of the nuclear or cytosolic fraction in either control or SARS-CoV-2 ORF6 expressing FLAG-NLRC5 HeLa stable cells. Asterisks indicate two distinct bands of NLRC5. Quantitative comparison of the cytosolic or nuclear FLAG-NLRC5 signal intensity normalized by the intensity of Lamin B1 (for nuclear NLRC5) or α/β-tubulin (for cytosolic NLRC5) is shown with a bar graph via analysis with ImageJ. The data shown is a representative result from three independent experiments.

